 Free Consultation


90th Percentile in Performance Testing
Percentile is a phrase that is frequently used yet is very crucial, particularly in performance assessment. We were aware of the 90th percentile as soon as we began reviewing any information on performance testing. Even our mentor placed greater emphasis on the response time data in the 90th percentile. So what precisely is this 90th percentile?
Let’s use an illustration to attempt to explain. If you had ten sheep, and each one consumed a few kilograms of grass each day. You once measured the grass and recorded the amounts that each sheep consumed. Please see the table below:
| Sheep# | S1 | S2 | S3 | S4 | S5 | S6 | S7 | S8 | S9 | S10 |
| Grass(kg) | 3 | 3.2 | 4 | 4.8 | 3.6 | 2.9 | 3.4 | 3 | 3.8 | 3.9 |
You must now ascertain how much grass 90% of sheep have devoured. Simply disregard the final value and order the number according to the amount of grass consumed.
Simply disregard S4 with 4.8 (keep it hungry for a few days, it eats so much; the 90th percentile value in 10 entries is a 9th value, which is 4).
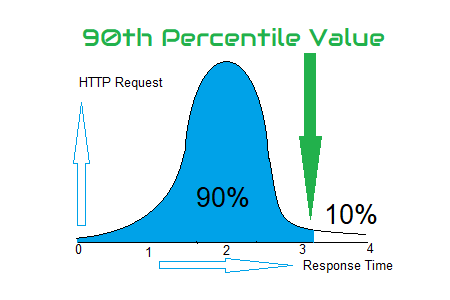
The result is that 90% of all sheep either consume 4 kilograms of grass or less, giving you a maximum allowable intake of grass. Performance testing requires that you discard 10% of the overall count with high values after sorting the response times of various transactions or requests in ascending order. The 90th percentile will be the last highest value among the remaining values.
Example:
A performance test script is executed for 25 iterations. The response time of the login transaction of each iteration is:
| S. No. | Iteration No. | Login (Response Time (in sec)) |
| 1 | 1 | 1.5 |
| 2 | 2 | 1.6 |
| 3 | 3 | 1.1 |
| 4 | 4 | 0.9 |
| 5 | 5 | 2.1 |
| 6 | 6 | 1.9 |
| 7 | 7 | 1.4 |
| 8 | 8 | 1 |
| 9 | 9 | 0.8 |
| 10 | 10 | 1.5 |
| 11 | 11 | 1.8 |
| 12 | 12 | 1.1 |
| 13 | 13 | 1.6 |
| 14 | 14 | 1.7 |
| 15 | 15 | 1.3 |
| 16 | 16 | 0.9 |
| 17 | 17 | 1 |
| 18 | 18 | 1.5 |
| 19 | 19 | 2.3 |
| 20 | 20 | 1.9 |
| 21 | 21 | 1.8 |
| 22 | 22 | 1.2 |
| 23 | 23 | 1.4 |
| 24 | 24 | 0.9 |
| 25 | 25 | 1.5 |
Now, sort the list in increasing order with respect to response time.
| S. No. | Iteration No. | Login (Response Time) |
| 1 | 9 | 0.8 |
| 2 | 4 | 0.9 |
| 3 | 16 | 0.9 |
| 4 | 24 | 0.9 |
| 5 | 8 | 1 |
| 6 | 17 | 1 |
| 7 | 3 | 1.1 |
| 8 | 12 | 1.1 |
| 9 | 22 | 1.2 |
| 10 | 15 | 1.3 |
| 11 | 7 | 1.4 |
| 12 | 23 | 1.4 |
| 13 | 1 | 1.5 |
| 14 | 10 | 1.5 |
| 15 | 18 | 1.5 |
| 16 | 25 | 1.5 |
| 17 | 2 | 1.6 |
| 18 | 13 | 1.6 |
| 19 | 14 | 1.7 |
| 20 | 11 | 1.8 |
| 21 | 21 | 1.8 |
| 22 | 6 | 1.9 |
| 23 | 20 | 1.9 |
| 24 | 5 | 2.1 |
| 25 | 19 | 2.3 |
How 90th percentile calculated in MS Excel?
90th Percentile = 0.9 * (Number of Values – 1) + 1
Why do we need the 90th percentile in Performance Testing?
- Percentile is frequently used as a performance benchmark. If the 90th percentile NFR for the specified SLA is met during the test, it indicates that 90% of users receive an experience that is consistent with your performance objectives. The customer feels more confident about his application as a result.
- Individual datasets can sometimes look normal while the average reaction time appears to be abnormally high. Even a single peak in response times might affect the test’s results and distort the average response time statistics. In these cases, the 90th percentile (or other percentile values) strips the result of the unexpected spike data.
- A statistician would describe the curve as having a long tail because the majority of applications really have very few big spikes on the graph. A long tail indicates a few transactions that are significantly slower than average rather than many sluggish transactions. The 90th Percentile is useful in this situation since it excludes the 10% of requests with the spike (which may be disregarded).
- If the median (50th percentile) response time is 5 seconds, 50% of transactions will be completed in or under 5 seconds. If a transaction’s 90th percentile time is 8 seconds, just 10% of transactions are slower than that, and 90% are as quick or faster. around this situation, the average might either be less than 5 seconds or somewhere around the middle. Because it displays a portion of the response time curve, a percentile provides a far better picture of real-world performance.
- The distribution of distinct data points may be estimated if we compute the difference between the 90th percentile value and the average response time value and divide this difference by the average response time value. If the ratio is quite tiny, it signifies that the average and 90th percentile values are fairly similar, which will signify that the application is performing well and consistently. A significant variance in reaction time and inconsistent performance of the application are indicated by a big ratio, though. The 90th percentile is helpful in this strategy, but I advise you to derive your conclusions only based on standard deviation.
Conclusion
A pretty good and simple technique to comprehend the actual performance characteristics of your application is through percentiles. They also offer a fantastic foundation for automated base-lining, application behavior learning, and properly focusing application optimization. Averages are useless, though, as they are oversimplified and one-dimensional. In the realm of performance testing, the percentile (90th, 95th, and 99th) is excellent!
 We are Online | Privacy policy