

Using the ‘mpstat’ command to monitor the performance of a Linux server is one of the most established and effective techniques to gather CPU information. The mpstat command helps track the CPU activity of each core if the system has a multi-core processor. In the case of a dual-processor, dual-core Linux kernel, the program will output statistics for 4 CPUs. Similar CPU utilization data are offered by the mpstat command as by vmstat, however, mpstat disaggregates the statistics by individual processors.
Multiple Processor Statistics is what “mpstat” stands for, while a few sites indicate something else for the letter “m.” Similar to “vmstat,” “mpstat” is a tool that offers statistics on processors.
Command Syntex:
$mpstat
Output
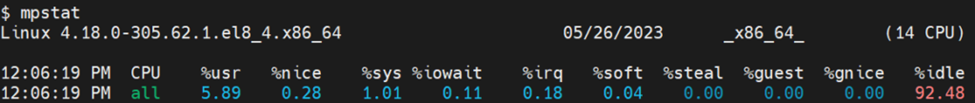
Figure 01
As shown in Figure 01, there are two components in the output of the mpstat command:
- The first section that is visible at the top is System Configuration. It offers fundamental system details, such as the version, server name, number of CPUs, etc.
- Utilization Statistics: The various metrics of CPU Utilization are shown in the second part. When using a delay value, statistics are shown as intervals, and the values of these metrics always change from the intervals before.
Domain Description
- Timestamp: The moment statistics were recorded.
- CPU: The processor number is displayed. The word “all” denotes that averages across all processors are used to calculate statistics. CPU 0 is assigned to the first processor, CPU 1 to the second, and so forth.
- %usr: It displays the percentage of CPU usage that occurred while an application was running at the user level.
- %nice: It displays the proportion of CPU usage that happened when a user-level task was being executed with the nice priority.
- %sys: It displays the proportion of CPU usage that occurred while system-level (kernel) operations were being performed. Notably, this does not account for the time needed to resolve hardware and software interruptions.
- %iowait: This indicator displays the proportion of time the CPU or CPUs were not in use when the system had a pending disc I/O request.
- %irq: It displays the proportion of time the CPU or CPUs spend handling hardware interrupts.
- %soft: This indicates the proportion of time the CPU or CPUs spend responding to software interrupts.
- %steal: The percentage of time the virtual CPU or CPUs were forced to wait while the hypervisor was tending to another virtual processor is shown by the symbol %steal.
- %guest: It displays the proportion of time the CPU or CPUs spent operating a virtual processor.
- %gnice: The percentage of time the CPU or CPUs spent running a nice guest is displayed by the notation %gnice.
- %idle: displays the percentage of time that the CPU or CPUs were not in use and that no disc I/O requests were pending.
Options
-A: It offers all of the statistics pertaining to the process at once. The ‘all’ number in the ‘CPU’ column gives the average of all the CPU statistics. What the ‘-A’ option means is:
$ mpstat -n -u -I ALL, N ALL, and P ALL
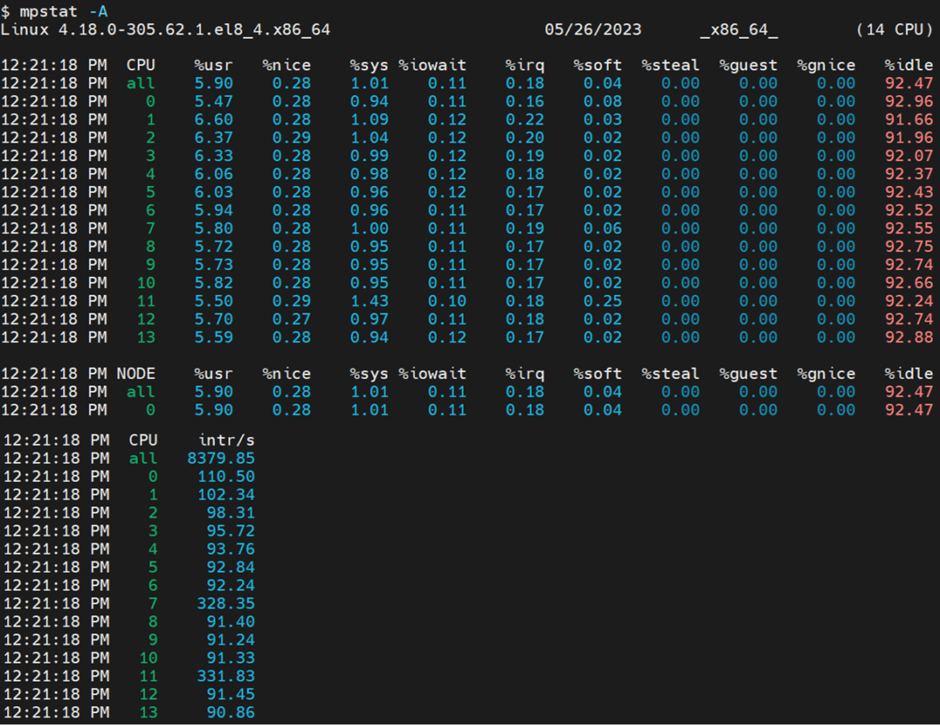
Figure 02
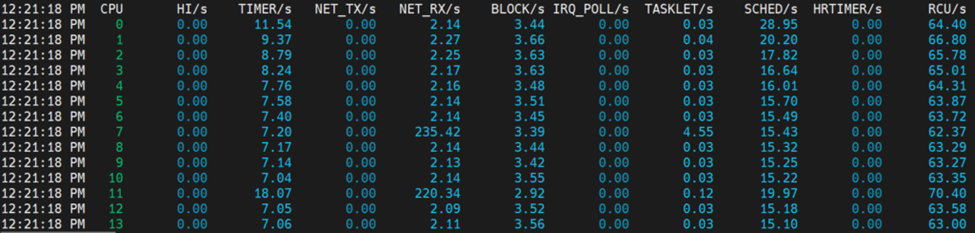
Figure 03
-I: This option provides the statistics about interrupts and its keywords are CPU, SCPU, SUM and ALL
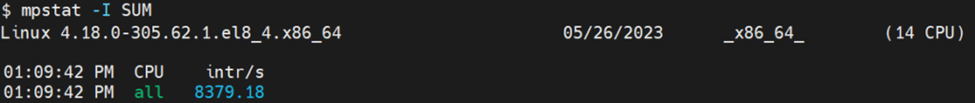
Figure 04
-n It displays node-wise stats. The possible keywords are <node-list> and ALL. The keyword ‘ALL’ indicates that statistics are calculated as averages among all nodes.
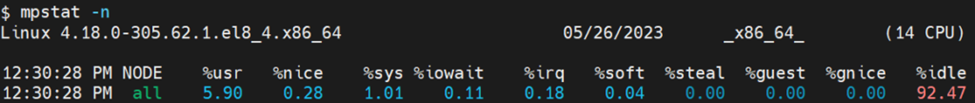
Figure 05
-o JSON: This option displays the statistics in JSON format.
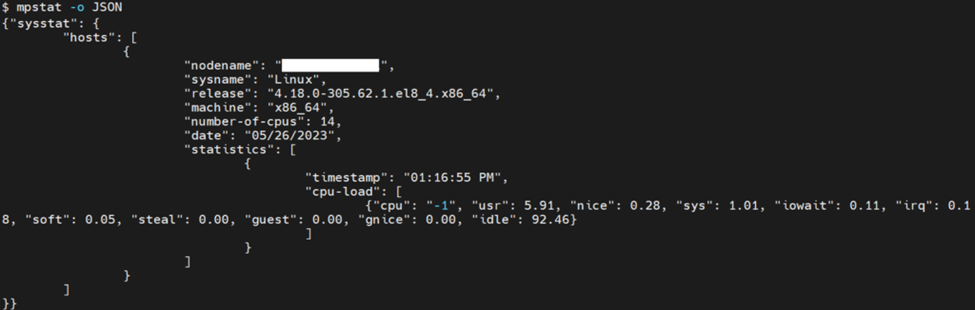
Figure 06
[Delay Value]: The number of seconds between each update to the command output. If no delay is set, the average values of all the CPUs are written on a single output. A delay of 5 seconds separates each command output in the example below.
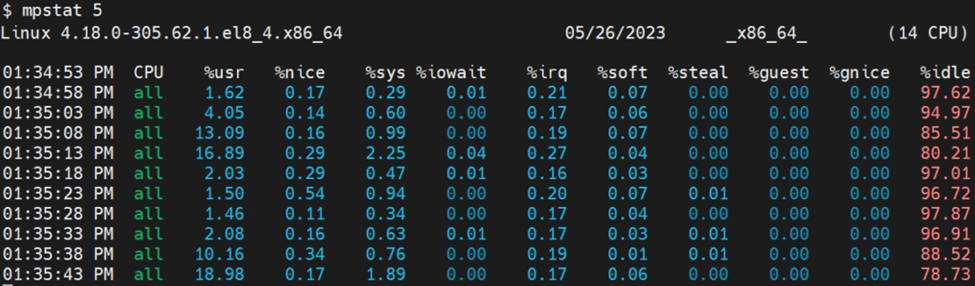
Figure 07
[Count Value]: This value indicates how many outputs are needed. When the delay is defined in the absence of a count value, the default is infinite outputs until the command is terminated. In the example below, the count number is 4, therefore just 4 outputs—along with the Average—are shown at intervals of 10 seconds.
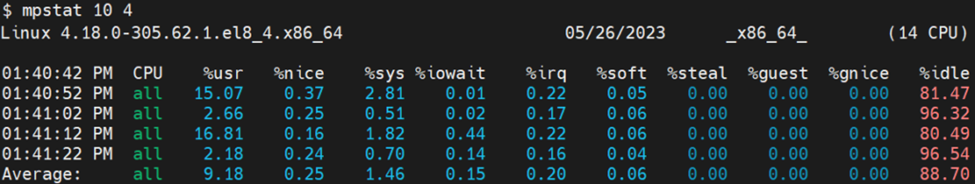
Figure 08
These are the significant mpstat command parameters and keywords.
How can I record mpstat when running a load test?
You must run the following command before beginning the load test:
mpstat $ nohup [Time Delay] (Count Value) (File Name) &
For instance, if you wish to do a load test for an hour and need to record server statistics in the mpstatLoadTest.dat file every 10 seconds, you would calculate the Count Value as follows: => 1 hour = 3600 seconds => 3600/ 10 = 360 // CountValue
And this is the order:
mpstatLoadTest.dat & $ nohup mpstat 10 360
After the test is finished, consult the mpstatLoadTest.dat file to assess the results.
How are mpstat files analyzed?
To analyze the mpstat file, just use MS Excel. You can plot the graphs by choosing the necessary columns after using the ‘Text to Column’ option to divide the statistics into columns.
- The value of “%usr” must be lower than 70%. (In ideal circumstances)
- If the “%iowait” value rises, the CPU will need to wait for the IO resource.
How can I record mpstat for every node in a load test?
You must run the following command before beginning the load test:
mpstat -P ALL [Delay Value] $ nohup (Count Value) (File Name) &
For instance, if you wish to do a load you st for one hour and server stats every 10 seconds should be put in mpstatLoadTest.dat file, calculate the count value as follows: => 1 hour = 3600 seconds => 3600/10 = 360 // Count value
And this is the order:
The command “$ nohup mpstat -P ALL 10 360 > mpstatLoadTest.dat &”
Important points
- Performance data for all logical processors since boot time is collected in a report using the mpstat command if no progress is reported.
- During performance tests, mpstat helps to understand CPU usage and Linux system pattern.
- To get Linux server monitoring information before, after, and during the test, calculate the count value leaving some extra time for the load test.