
There are several ways to generate a thread dump, especially on a Windows server. The steps to create a thread dump on a Unix, Linux, or Windows computer are as follows.
Through a Unix Server
Step 1 – You must know the Java Process ID currently running on the server before generating the Thread Dump. The “jps” command on a Unix server can be used to get the Java process ID (PID). 54351 is the process ID (PID) of the NMSDaemon Java thread in the screenshot below.
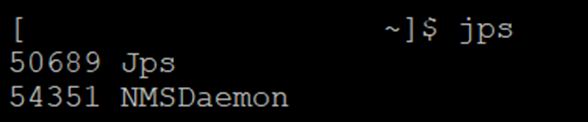
Figure 01: ‘jps’ command
Run the command “jps -v” if you want to see the details of the process.
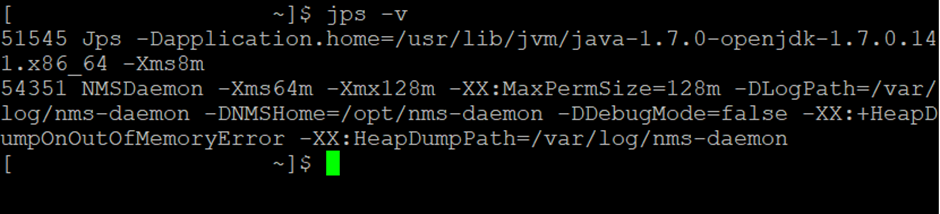
Figure 02 ‘jps -v’ Command
Step 2 – Using the “jstack PID>” command, you can inspect the thread dump after getting the PID (eg 54351).
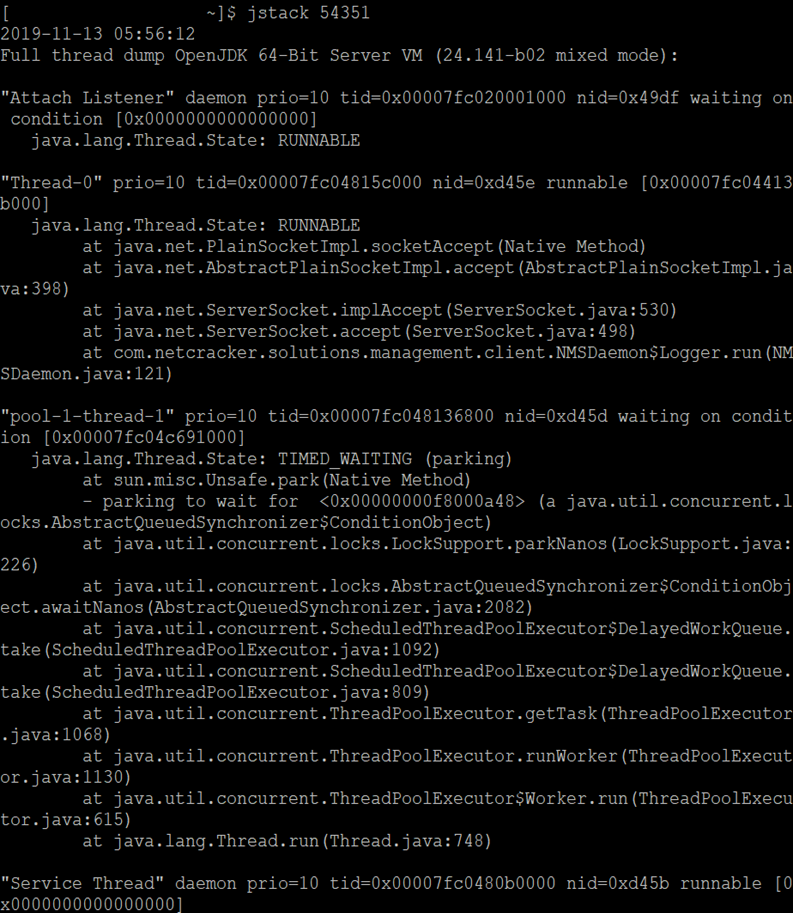
Figure 03 – Creating a thread dump with the ‘jstack’ command
Use “jstack -l PID>>path and filename>” to extract a thread dump to a file.

Figure 04: Extracting the thread dump in a file
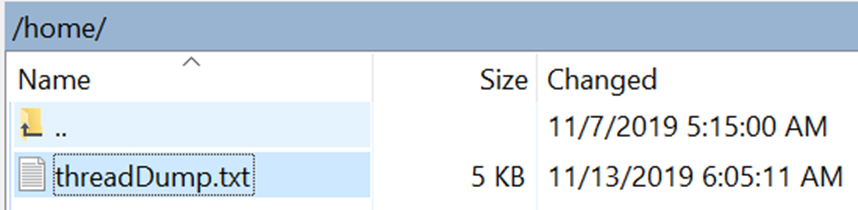
Figure 05 – Thread dump file
Note: The ‘jstack’ tool has been part of the JDK since the release of Java 5. Run the command “kill -3 PID>” if your Java version is older. The standard error stream receives a thread dump when this command is called. If the application is running on Tomcat, a thread dump is sent to the <TOMCAT_HOME>/logs/catalina.out file.
Using a Linux server
Step 1: To get the Java process ID, use “ps -ef | grep java”
Step 2: Use PID and the “kill -SIGQUIT” command.
With Windows server:
Step 1: Download javadump.exe as the first step.
Step 2: Start the JVM with these three arguments (in the correct order of course):
-XX:+UnlockDiagnosticVMOptions-XX:+LogVMOutput- XX:LogFile=C:\temp\jvmoutput.log
Step 3: Press Ctrl+Shift+Esc to launch Task Manager.
Step 4: Find the PID of the Java process (in the “Details” tab).
Step 5: Run the command “javadump.exe” from the command line.
Step 6: The jvmoutput.log file specified in step 2 contains the thread dump.
An additional technique for creating and analyzing thread dumps on Windows servers is:
Step 1: Open the JDK bin directory (for example, C: Program FilesJavajdk1.8.0_131bin).
Step2: Click on “jvisualvm.exe” to start JVisualVM.
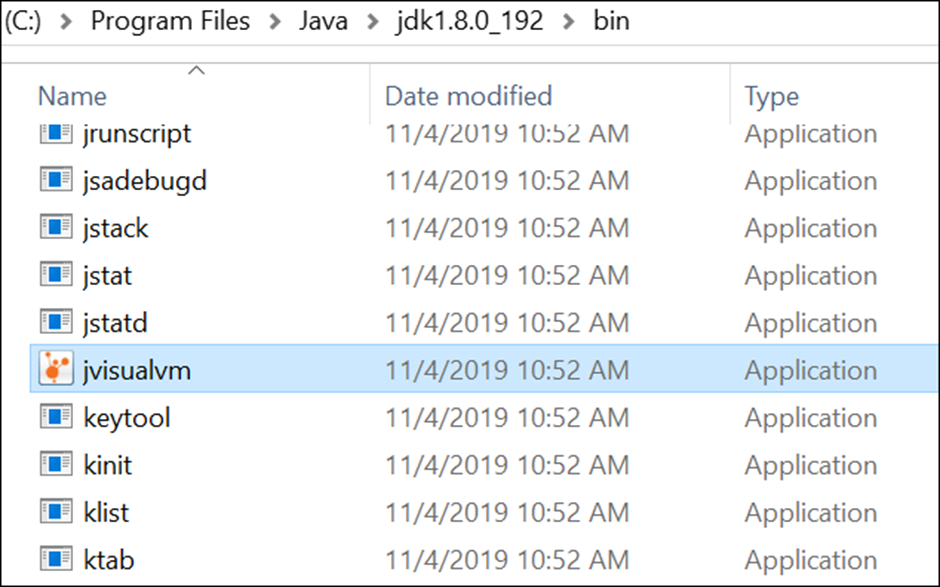
Figure 06: ‘jvisualvm’ location
Step3: Launching the Java VisualVM tool
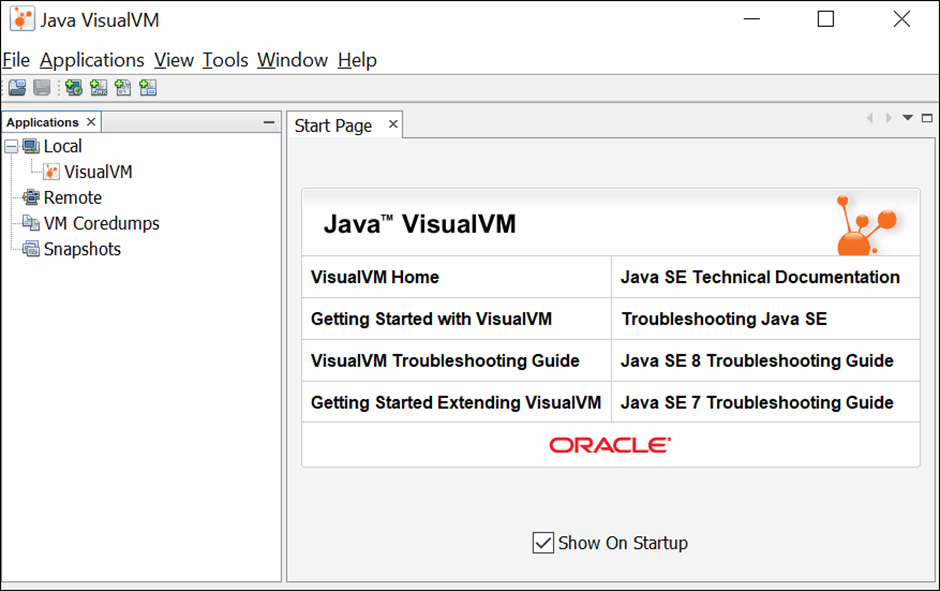
Figure 07: Java Visual VM Home Page
Step 4: Use the context menu to find the Java process in ‘Local’.
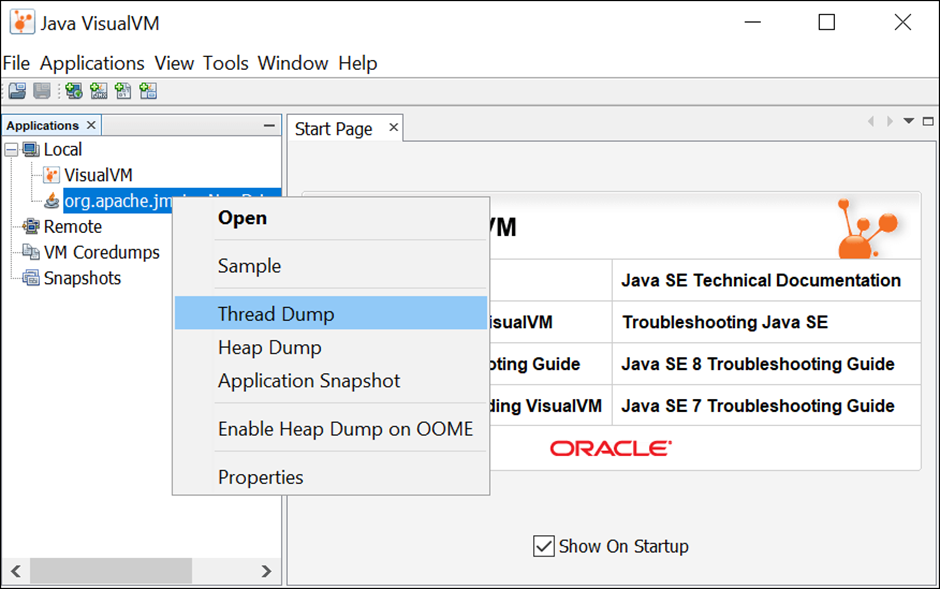
Figure 8 Thread Dump Generation in Java Visual VM
Step 5: Click “Thread Dump” in step five. The thread dump is created and available for analysis in the right pane.
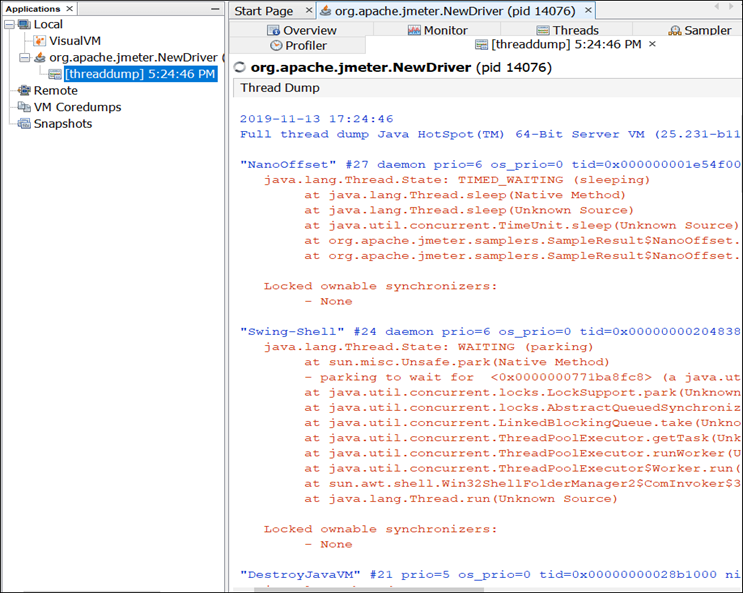
Figure 09 – VisualVM Java Thread Dump