

You learned how to create a thread dump on different operating systems in the previous post. The question “How to read Thread Dump?” arises after generating the thread dump. The first part of a thread dump contains general information, and the second part contains thread details useful for analysis. Let’s use an illustration to understand them:
Open any thread dump files you may have in Notepad++ or Java VisualVM and compare them to the following statements.
- The first row displays the thread dump generation timestamp in the following format.
| 2019-11-14 05:12:51 |
- The JVM information from which the generated dump is derived is displayed in the second row.
Full thread dumps OpenJDK 64-Bit Server VM (24.141-b02 mixed mode):
- The following details refer to threads. Please see the rules below. Listed below are two threads that contain relevant information and help in dump analysis. Follow the color code to see the descriptions of the fields:
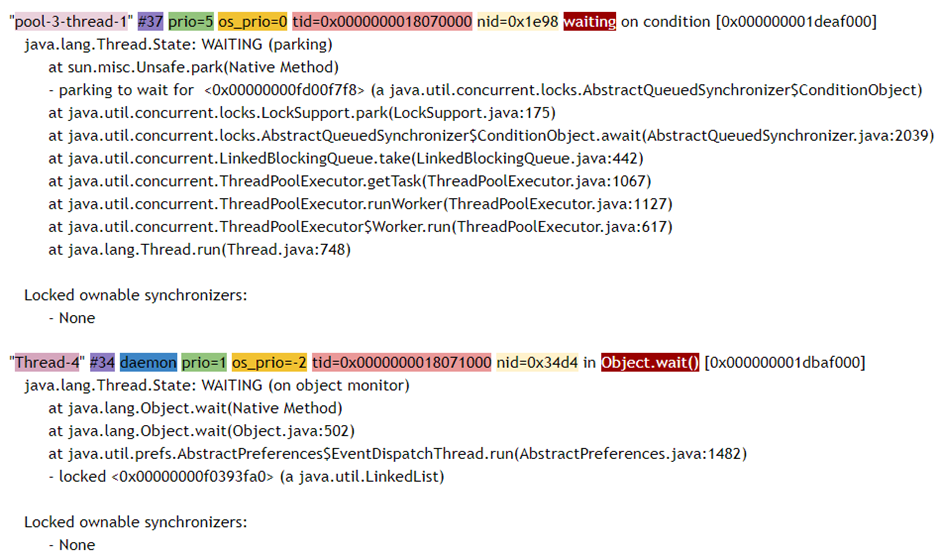
Attributes Description:
Thread Name: A thread created by the java.util.concurrent.ThreadFactory class is named pool-number>-thread-number>. Following the previous example, pool-3-thread-1 is the name of the first thread.
Thread number > is the thread’s name when spawned by the java. Lang.Thread class. The second thread in the above example is identified as “Thread-4”. The thread name is provided in a human-readable format for ease of parsing.
| Thread ID (#): |
The thread ID is a unique ID. The distinctive thread identifier is represented by this number. It must start from 1 and increase before being assigned to a completely new thread. To get information about the CPU and memory usage of the thread, this thread ID is very useful. The thread IDs in the above example #37 and #34 are the thread IDs of respective threads.
| Daemon Status: |
This label indicates the thread’s status as daemon or non-daemon. This tag is present if the thread is a daemon. No-tag is present if the thread is not a daemon thread. The first thread in the above example is a daemon thread, while the second thread is a non-daemon thread. As a result, the daemon property for the first thread is missing, as shown.
For more information on cable types, see the publication.
| Thread Priority (prio): |
The thread priority is indicated by the tag. In the above example. the first thread has priority 5, while the second thread has priority 1.
| OS Thread Priority (os_prio): |
the OS-based priority of the thread. As you can see, the os_prio values of the respective threads are 0 and -2.
| Address (tid): |
the memory address of the native thread object in Java.
| OS Thread ID (nid): |
the distinguished ID of the operating system thread to which the Java thread is assigned.
| Thread Status: |
The status of the thread at the time the thread dump was created. All thread states were covered in the Thread Life Cycle post.
Stack Point and the other labels
The remaining details pertain to the resources that the thread used. Reading the statements clarifies how the thread is blocking some resources and how others are waiting on the thread. These data are mainly used for analytical and diagnostic purposes. Please see the following post for a detailed explanation of the thread dump parsing section.