
FastThread is a good thread dump analyzer that has all the essential tools needed to examine both simple and complex thread dumps. It is a URL-accessible open-source program that is available online. FastThread is a type of analysis tool that is mostly used in performance engineering to determine the precise cause of a problem caused by a Java Thread. This program is used by performance engineers and software developers to find and fix thread processing problems. The Thread Dump Analysis discussions have already covered the potential problems.
How can I use the fastThread tool to analyze a thread dump?
The steps to use the FastThread tool and perform thread dump analysis are listed below.
- Using the URL: http://fastthread.io/

Figure 01: fastThread Home Page
- Look over the Thread Dump file and upload it. A total of 5 thread dump files can be uploaded at once. The file formatss.zip ,.gz,.dump,.txt, and others are supported by fastThread. To eliminate file size issues, it is a good idea to upload.zip or.gz files.
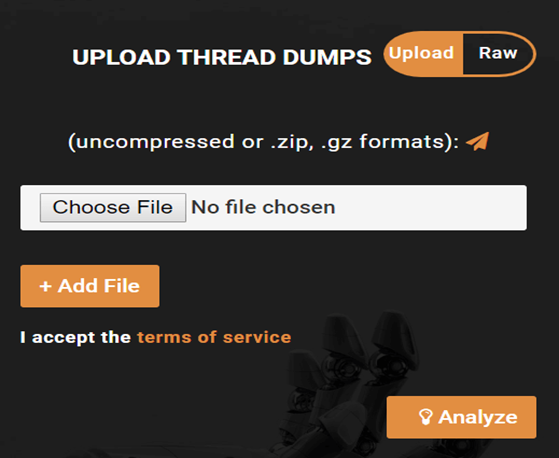
Figure 02: fastThread-Upload-File
- Press the ‘Analyze’ button. Within a short period of time, fastThread begins analyzing the thread dump and displays the analysis report.

Figure 03: Analysis Progress Bar
- FastThread provides the thread dump analysis data on the dashboard
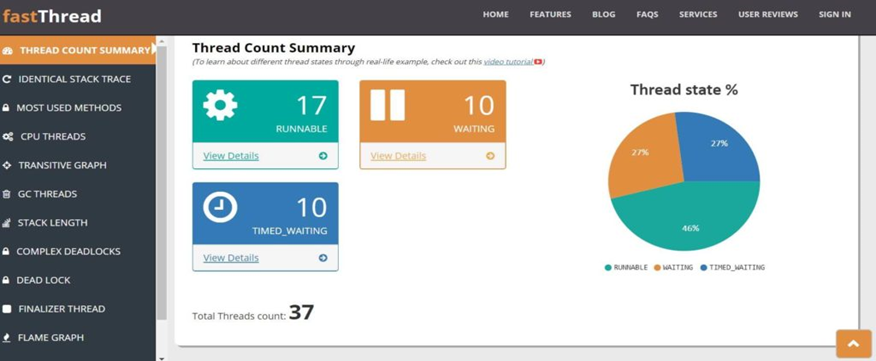
Figure 04: fastThread Dashboard
- The thread dump summary is located in the dashboard’s first section under the headline “Thread Dump – Intelligence Report.” The thread dump file name, timestamp (the moment the thread dump was taken), and JVM version are all listed in this section. Additionally, it offers download and sharing options for the report. This section’s ability to confirm whether or not threads are problematic adds to its significance. A happy face implies that there is “no issue” in the thread dump and that the application is functioning normally, whereas a sad face denotes “the existence of the issue” that needs to be looked into further. Please see Figure 05.
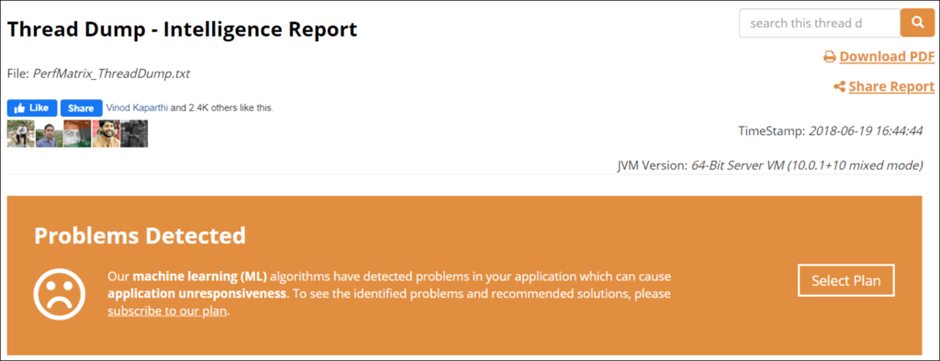
Figure 05: Intelligence Report
- The analysis begins with the ‘Thread Count Summary‘ tab. The total number of threads running in a process is displayed on this tab. You can obtain the thread state, such as Runnable, Waiting, Timed_Waiting, and Blocked, in addition to the thread count (see the post for additional information on thread state). To view additional information about the threads, click the ‘View Details’ link provided under each thread state.
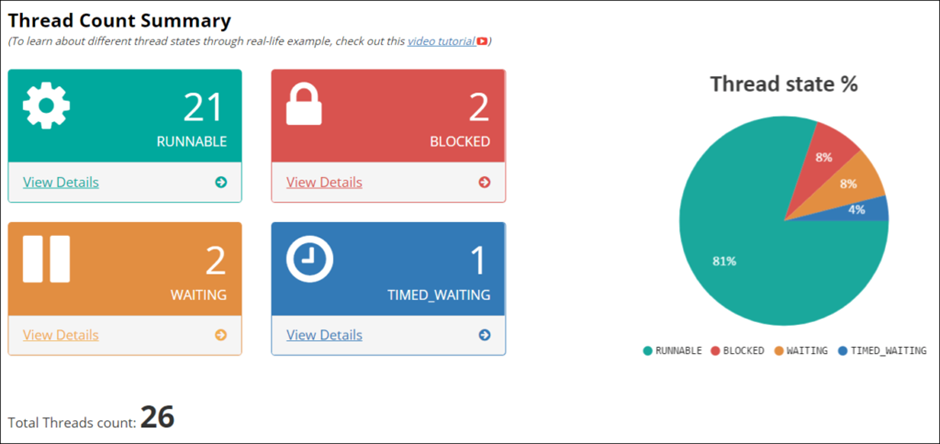
Figure 06: Thread Count Summary
- In this section, groupings of threads with similar names are displayed in a pie chart format. Additionally, you can refer to the table that lists the name of the thread group, its number, and its state.
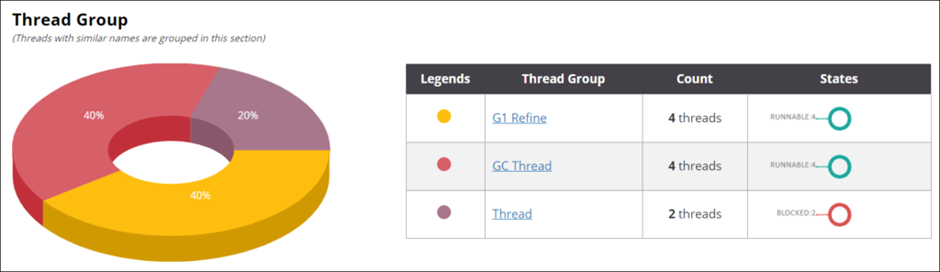
Figure 07: Thread Group
- Information regarding daemon and non-daemon threads is presented in the next section. To get more details about the thread, click the “View Details” link.
Daemon Thread: The daemon thread runs in the background and has a low priority, carrying out duties like garbage collection, etc. A daemon thread may be associated with a number of non-daemon threads, and it terminates when all of those threads have finished running or have died.
Non-Daemon Thread: This type of thread is also known as a “User Thread”.
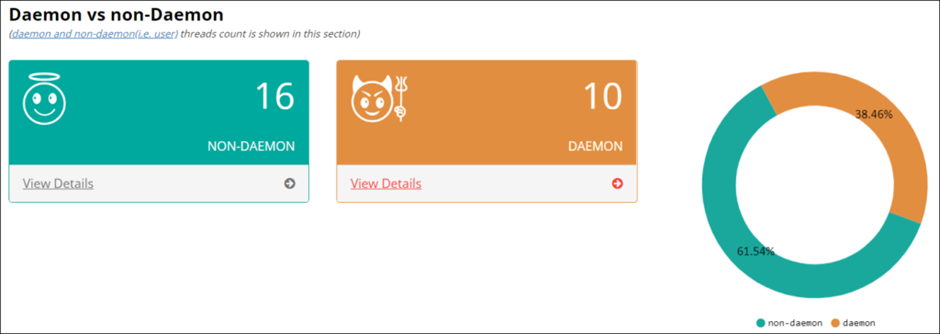
Figure 08: Daemon vs. Non-Daemon Thread
- FastThread provides a clear indication in the Dead Lock section if any deadlocks exist. Referring to Figure 08, a deadlock was created by Threads 0 and 1. In order to pinpoint the precise cause, fastThread additionally displays the resources for each thread that are “waiting to lock” and “locked.”
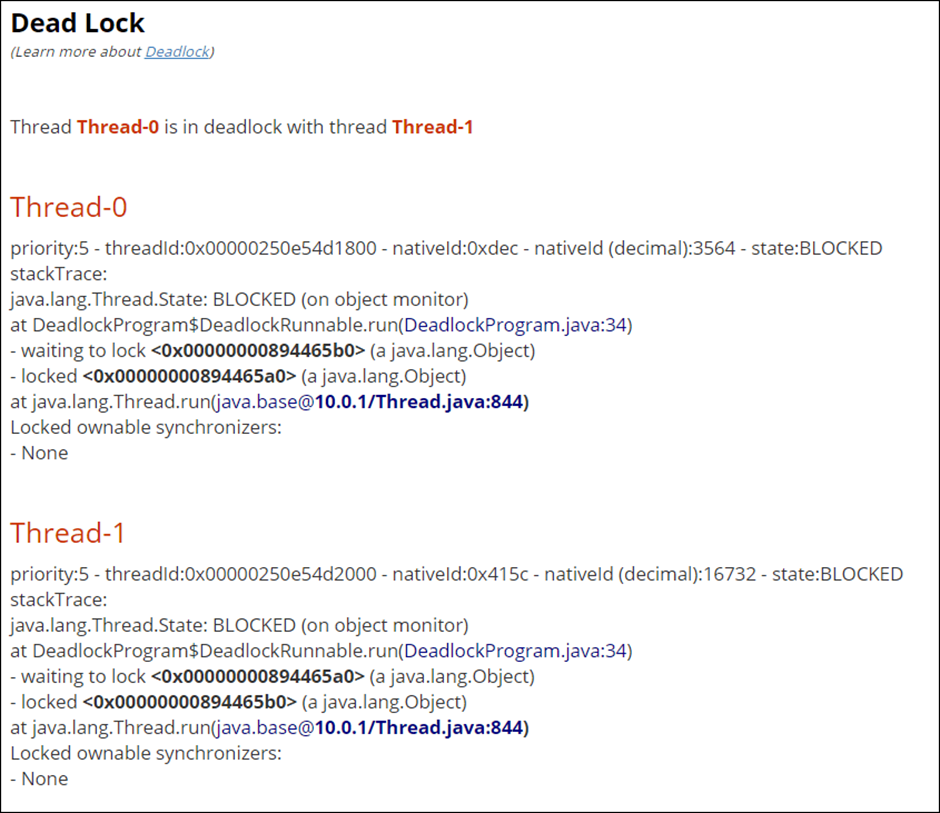
Figure 09: DeadLock
- You can view the thread count using the same stack trace in the following section. The number of threads with the same stack is displayed on each individual bar. For further information on the stack trace, see the table below this diagram.
When an application experiences a performance bottleneck, the majority of the threads begin to congregate on the troublesome bottleneck location and create the same stack trace. So, anytime a sizable number of threads display a similar or repeating stack trace, examine the stack trace and conduct additional research.
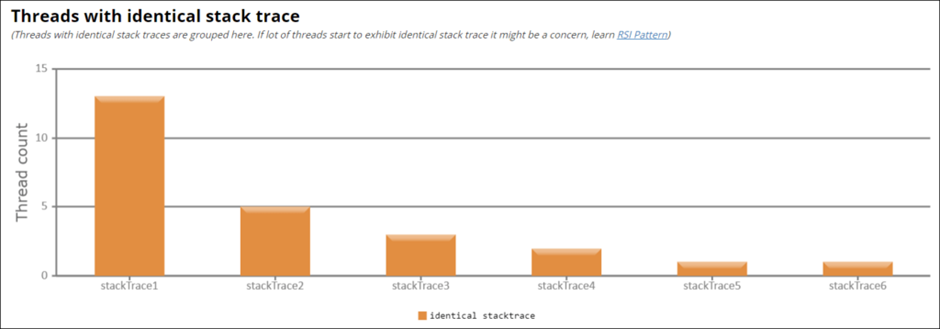
Figure 10: Threads with identical stack trace
- The following section, under “Most used methods,” contains a list of frequently used techniques. When multiple threads in a thread dump are found to be working on a single method, it may be cause for concern. A large number of threads frequently congregate in a single procedure when there is a difficulty, such as a slow data source, an unreleased lock, infinite looping threads, etc. A thorough analysis of that particular procedure is required.
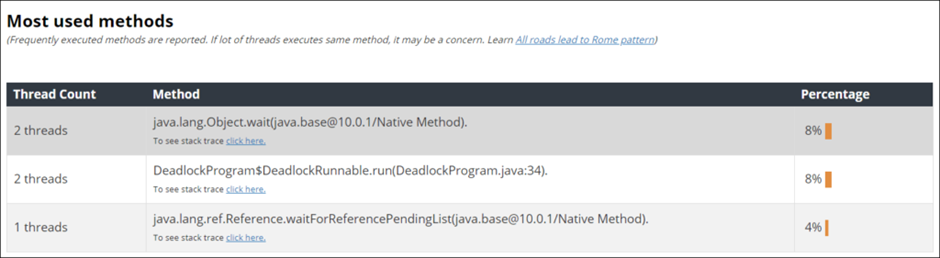
Figure 11: Most used methods
- The CPU consumption portion comes next. This section lists the methods that use the greatest CPU resources together with the number of threads that are using those methods. Several threads are really marked as “Runnable” by the JVM even if they are idle and waiting for resources. Such awaiting threads don’t result in considerable CPU usage. In order to continue looking into the high CPU issue, you should first identify the actual “Runnable” threads.
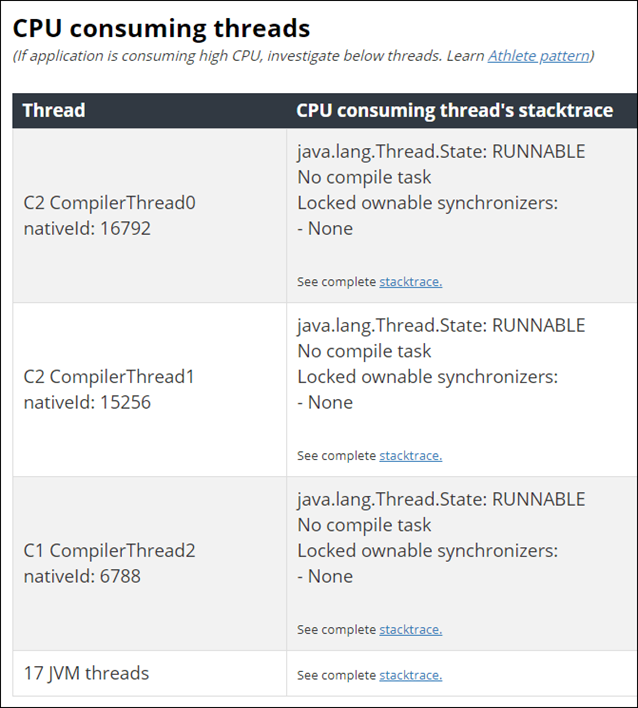
Figure 12: CPU-consuming threads
- A transitive graph can be used to determine the blocked thread. You can see how pool-1-thread-1 blocked the pool-1-thread-2 and pool-1-thread-3 threads in Figure 13. The application becomes unresponsive due to blocked threads, hence proper diagnosis and root cause investigation should be done.
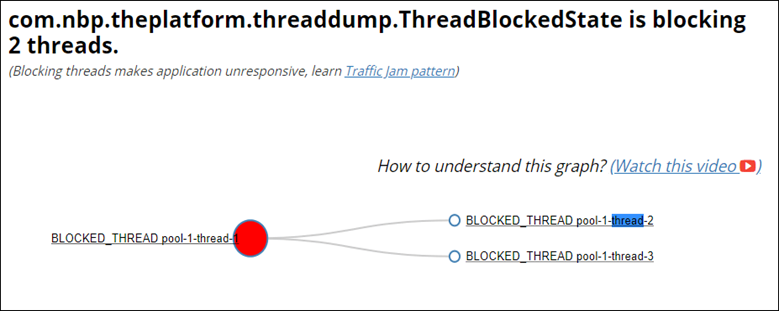
Figure 13: Blocked Thread
- How many GC Threads were active at the time of the dump is shown in the GC Threads section. The kind of GC and its default configuration affect the number of GC Threads. However, the system performance is affected by the development of extra GC threads. Thus, it is important to carefully configure the GC thread count. The “View Details” option displays all of the GC thread’s information as well as the GC type.
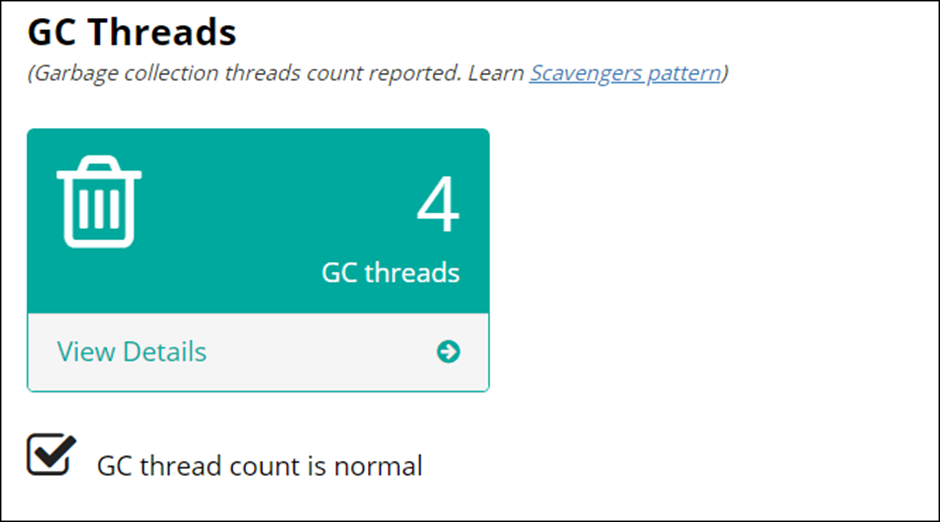
Figure 14: GC Threads
- Methods, primitive data types, variables, object pointers, and return values are stored in a thread’s stack. These all require memory. StackOverflowError is thrown if thread stack sizes exceed the allotted memory limit. The thread stack length and thread count are provided in the Thread Stack Length section. The fact that fastThread determines if the stack trace length seems normal or not is a plus.
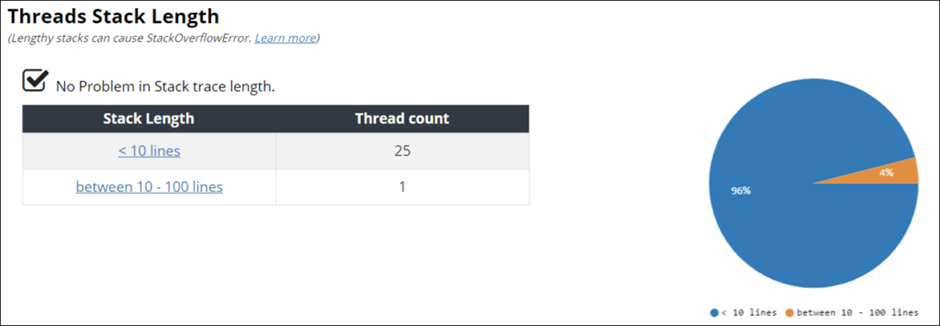
Figure 15: Threads Stack Length
- You can glimpse the significance of the Finalizer Thread in the GC. Because the object is now eligible for garbage collection after the finalize() method has been executed. Poor finalize() method implementation can cause the Finalizer thread to become blocked, which could have a serious negative cascading effect on the JVM.
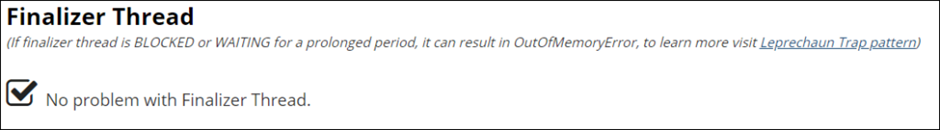
Figure 16: Finalizer Thread
- A unified view of all thread stack traces is provided by Flame Graph. To verify the thread stack trace, click the method in the flame graph.
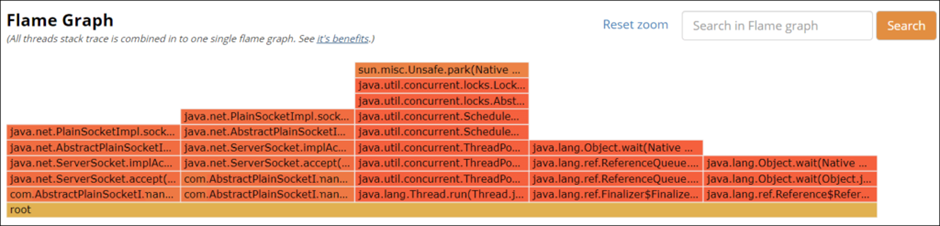
Figure 17: Flame Graph
- Thread Dump Analyzer. Bottom-up Call Stack Tree gives you a single view by combining all of the threads’ stack traces into a single tree. The thread dumps navigation is much simplified and made easier.
bottom-up thread dump analysis with fastThread Stack Tree call
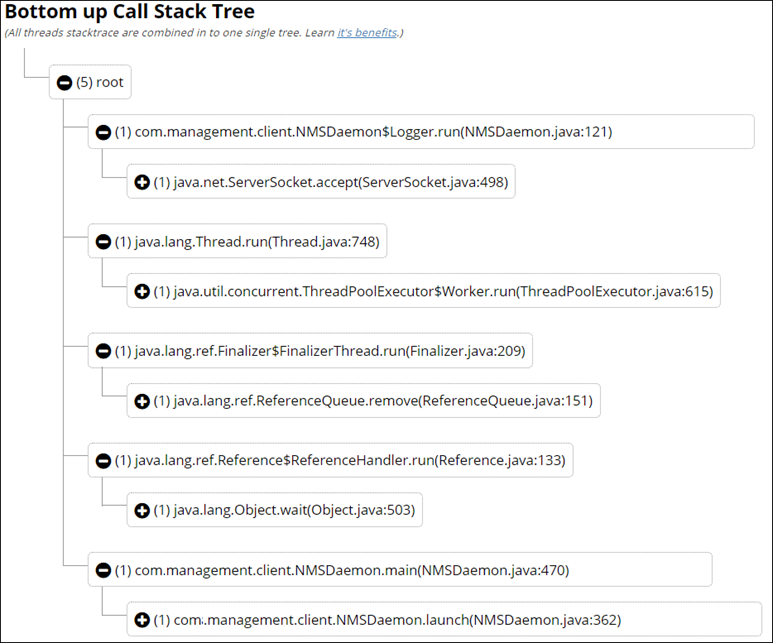
Figure 18: Top-down Stack Tree call
Conclusion:
Fastthread is a very helpful web tool for analyzing thread dumps and displays a thorough representation of each thread. You may identify the current problem and flag it for the client or development team with only one click. All performance testers or developers, in my opinion, can improve their understanding of Thread Dump and its analysis by using the fastThread tool.