
As performance testers, we are often faced with the question of whether the data we provide is accurate. The most common question a performance tester encounters is the following after they have identified themselves using the supporting documentation for load testing tools.
What is the browser page load time? Or, what is customer-perceived response time or end-to-end response time?

Previously, the question above was resolved by running a timer test during the load test for important business transactions. However, the stopwatch test is now deprecated and considered error-prone testing due to advanced architectures and technologies that have been recently implemented.
Every organization strives to shorten the time to market. Continuous integration/continuous delivery (CI/CD) and the Agile approach are now widely used. This has expanded performance testing far beyond its original scope. Basic knowledge of test automation with Selenium WebDriver and browser plugins is currently assessed as a “preferred skill”, although a performance test engineer is not required to design a test automation framework.
Anyone who has delved into this topic in the past will have come across numerous tools and techniques such as Google WebpageTest, Google PageSpeed, Yslow, HttpWatch, Fiddler, etc.
I’ve provided a simple example with code below, though most of us would have come across this hypothetically.
Selenium Automation script integration with JavaScript Navigation Timing API
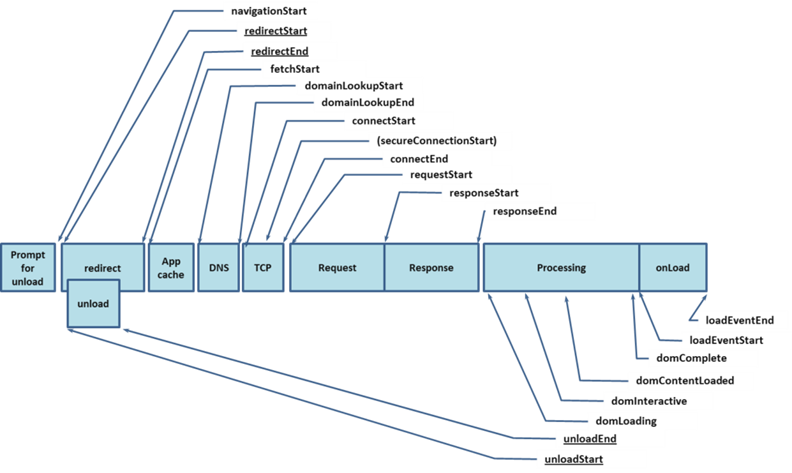
Javascript Navigation Time API Overview
This API allows us to get the most accurate time information regarding browser events from the moment we enter a URL in the browser until the page is displayed. For a detailed explanation of the activities that take place during the HTTP request and response lifecycle, see the URL and image below.
Javascript Navigation API Reference
Requirements
- Basic knowledge of Java, Maven, Selenium, and JSON.
- Installed and saved in the folder C:tmpchromedriver.exe
- Chrome WebDriver and Selenium-Java Project (3.11.0) configure the Oxygen.3 Release (4.7.3) version of the Eclipse IDE.
- Download the Maven project repository for JSONSimple 1.1.1 added.
I created a simple Java way to get some key performance indicators on the client side. Immediately after sending the HTTP request to the server in a Selenium script, this function should be called.
Examples: include the submit/next button, hyperlinks, and web driver. get (URL).
- ResponseStart-NavigationStart = TTFB (time to first buffer)
- Time to fully load a page = loadEventEnd-responseStart
- Start Navigation – Total Response Time = loadEventEnd
What does this simple code do?
- The WebDriver object and the name of the JSON file [output] are passed as arguments to the following function.
- A JavascriptExecutor object is written from a Webdriver object.
- TTFB, Page Load Time, and User Perceived Time in Variables are the three most important performance metrics collected on the client side.
- All key-value pairs are added to a JSONObject instance that has already been created.
- The filename specified in the method argument is written when the toJSONString function returns the content as a string.
- Close your browser and end all transmissions.
How to call the writePerfMetricasJSON() method with an example?
| public static void main(String[] args)throws Exception { //Selenium WebDriver code System.setProperty(“webdriver.chrome.driver”, “C:\\tmp\\chromedriver.exe”); WebDriver wd1=new ChromeDriver(); String url=”http://www.msn.com”; wd1.get(url); wd1.manage().window().maximize(); // Pass Webdriver object and the filename in which the JSON content would be written writePerfMetricasJSON(wd1,”Demo3.json”); } |
Output
| {“PageLoad Time”:1331, “TTFB”:1195, “Customer Time”:2526, “Timestamp”: “2018-06-10 16:41:21.908″,”URL”:”https:\/\/www.msn.com\/”} |
Code:
You can get the complete Java source code from the following GitHub URL. code completed Although this code looks extremely simple, once the necessary statistics are collected as JSON in a file, it can be directly processed using JQuery and HTML or other technical