
I’ll go over how to use LoadRunner for performance testing in this post. Since the Performance Testing Life Cycle (PTLC) is a broad subject to address and is covered in the other piece, I won’t claim that this is an explanation of the PTLC. You can refer to the PTLC issue later, but for the time being, you can think of this debate as falling under the PTLC and focusing solely on LoadRunner.
Basically, LoadRunner goes through five major processes. Almost all of the performance testing products on the market now use the same procedures as LoadRunner. Although the process of working could be different, the fundamental ideas are the same. Okay, let’s get back to LoadRunner as we shouldn’t stray from it. There are five main steps to running the test with LoadRunner, as I said, and they are as follows:
- Creation of Scripts and Scenarios
- Execution and supervision of tests
- Result Collection, Analysis
- Reporting
All of the PTLC phases and their associated duties are shown in the image below (picture 01). The tasks that have been exposed are related to LoadRunner, or you could say that LoadRunner performs those tasks. See the graphic to see where and how the fundamental LoadRunner phases are integrated into the PTLC.
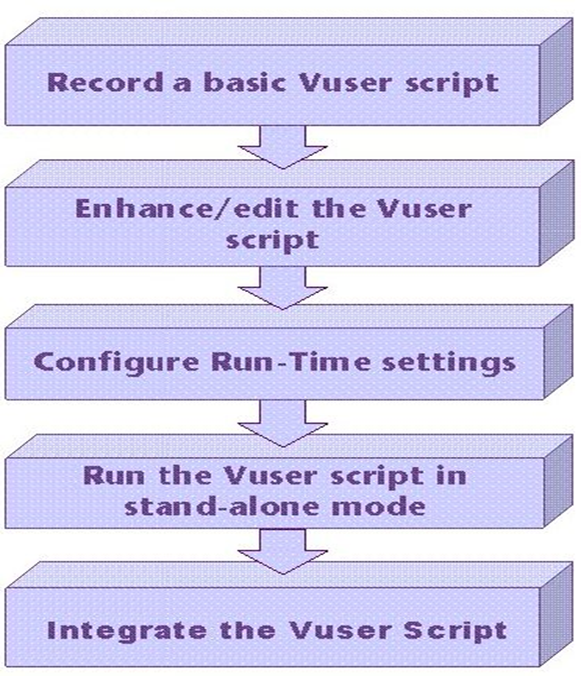
Figure(1)
- Script Creation:
To record the business flows, LoadRunner has a special component called “VuGen,” also known as “Virtual User Generator.” VuGen records the actual user’s website navigation and translates it into a language known as “Script.” The quick and simple-to-learn ANSI C scripting language is supported by VuGen. Since most programmers are familiar with and use the basic language “C,” writing LoadRunner scripts is a simple effort. It is simple to define variables and functions, write custom code, and apply new logic in C, which gives LoadRunner an easy scripting option. three main components go into creating a LoadRunner script: - Protocol Identification: Before writing a script, you need to be aware of the platform and technology used by the application it is based on. Ask the application architect or developer for these details if you are unsure. Prior to Micro Focus’ discontinuation, VuGen included a tool named “Protocol Advisor” to help identify the supportive protocol. As a result, you must independently gather knowledge on protocols and select the appropriate one. Depending on the application, you may need to choose a number of different protocols to record it.
- Script Recording: The main benefit of LoadRunner is its script recording feature. It saves time and work for a performance tester by not requiring them to develop manual code and provides recording for 90%–95% of protocols. Sometimes you have to build bespoke code, but that would just be straightforward reasoning.
You can start script recording by simply surfing the websites in accordance with the business flow after choosing the appropriate protocol. Once the flow is over, the recording can be stopped. To scan the recording logs and produce the script, VuGen needs some time. Web services don’t use recording practices, hence their script-generation processes are unique. - Enhancing the script: LoadRunner produces a fairly simple script devoid of parameterization, sophisticated correlation, etc. Script enhancement is the process of modifying the script to meet your needs using the options provided by LR and by creating some custom logic. Upon conclusion of recording, script enhancement completely automates the VuGen script. The steps for script enhancement are as follows:
- Parameterization
- Correlation
- Insert Transactions (Adding new transaction, if not given at the time of recording)
- Add Rendezvous Points
- Insert Basic Function (like lr_think_time())
- Insert Comments
- Enable Log Messages (if required)
- Insert Synchronization Points (RTE Vusers only)
- Set up the Run-time setting
You may choose to omit some of the stages if you choose. The script is prepared for test execution once the work on script enhancement is finished.
2. Creating a scenario:
A scenario outlines what and how the test will be carried out. The script(s), defined workload model, list of machines (Load Generator), and test duration make up a LoadRunner scenario. According to NFR, a specific set of business processes outlined in the LoadRunner script call for performance testing.
Either ‘Controller’ in LoadRunner or ‘Test Plan’ in Performance Center is used to generate a scenario. You configure and schedule the scenario as you plan it, and this affects how all of the load generators and Vusers operate during the test. You need accurate non-functional requirements (NFRs) before you can design a scenario, particularly the user count and anticipated TPS (transaction per second). The scenario needs to be designed in such a way that the anticipated numbers (User Load and TPS) can be met. To get the desired results, you occasionally need to add thought time and pacing to writing.
Check out the following calculators to help you build the correct scenario:
- Rhythm
- Time to think
- Number of users
- TPS Mandatory LG number
3. Execution and monitoring of tests:
In this phase, you just “run” the scenario you created and start viewing the graphics. You can be sure that the performance test is performed according to the test scenario and that all Vusers follow the same business processes that are described in the scripts. Vuser script transactions are tracked by LoadRunner during test execution and are displayed on the dashboard. LoadRunner provides numerous monitoring graphs that display client-side statistics. Some of these are response time, TPS, active users, throughput, system performance, etc. Monitoring server-side statistics is another benefit of integrating some third-party monitors, such as SiteScope.
4. Collection and analysis of results:
The controller collects and compiles the results after the conclusion of the test. The data collected is presented in raw form. You can also get the test results in HTML format by using the Performance Center and selecting the ‘Collect and Analyze’ option. These test result files can be downloaded to local computers.
The ‘Analysis’ tool in LoadRunner is a special tool for analyzing the results. The analysis tool has the ability to read the raw test results file and present it in graphical and tabular form. Numerous features of the analytical tools allow a thorough examination of the results to identify the real bottlenecks. Applying filter, correlation, merging, and overlay options to graphs will help you complete your problem diagnosis.
5. Reports:
Numerous report formats are available with the analysis tool. Once the test analysis is complete, you can create the report in the desired format such as .doc, .docx, .pdf, .html, etc., the charts you want to include in the report, etc. To help the client or project understand who participated in the testing, the reporting also includes a feature that allows you to include the organization’s logo, author’s name, tester’s name, etc.
These are the first five essential stages of performance testing with LoadRunner. This article provides a high-level overview of all the fundamental stages of LoadRunner. Detailed information is not covered. More details on this topic will be explained in later sections of the tutorial.