
Error Graph
One of the most fundamental graphs, it is usually used to identify the performance bottleneck. The error graph gives information on the kind of mistakes that happened and when they happened. The study into performance problems might begin with an examination of error graphs. The response code can be used to classify the issue. If the response code is HTTP 4XX, the problem is client-side input, such as an incorrect URL, header, or value. If the response code is HTTP 5XX, the server side is where the inquiry should be focused.
The phrase used to display the error graph in various tools is:
Error per second graph for LoadRunner, errors per second (by description) Error Statistics by Graph (by Description) Total Errors per Second Graph, Error Statistics Graph, and Graph.
Error (Tabular Format) and Codes per Second Graph in JMeter
Error rate and Errors in NeoLoad
Error Graph axes represent:
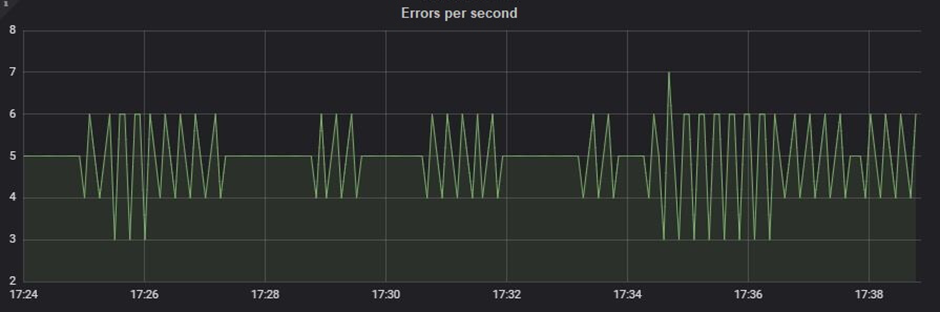
- X-axis: This graph shows elapsed time on X-axis. The elapsed time may be relative time or actual time as per the setting of the graph. The X-axis of the graph also shows the complete duration of the test (without applying any filter).
- Y-axis: It represents the number of errors at a particular time.
How to read:
The graph line displays the number of errors per time interval, such as per second, per minute, etc. If the graph permits, you may click on the line to view the error’s description at the bottom of the chart by doing so. Try to look into the reason for the problem with the aid of an error description. If you do not have access to the server log, send the error timestamp to the person who has the authority to review the server logs and request that he offer you further information about the event that took place at the given timestamp.
Merging of Error graph with others:
To obtain the user count at the time the mistake occurred, you can combine the error graph and the user graph.
With the Response Time graph: To observe the effect of mistakes on the performance time of requests, the Response Time graph and the Error graph may be combined.
Throughput: The error graph and throughput graph may be combined to show the effect of mistakes on server data.