
Compare Method
According to the ComCorDEEPT approach, the first and most important way of Performance Test Result Analysis is “Compare.” The ‘Compare’ technique is an easy way to compare the specified NFRs to the actual outcome. You may compare the specified vs. real response times to draw conclusions about the outcome, for instance, if the defined response time NFR for a login page is 5 seconds and you saw the actual response time during the load test was 4.2 seconds. The real reaction time in this instance is faster than anticipated. Similar comparisons may be made between transactions per second (TPS), throughput, resource use, etc.
How does the ‘Compare’ method work when NFRs are not predefined?
For New Application: In this situation, you must use the step-up test strategy. This method involves starting the test with a low user load and gradually increasing it until the program crashes. The trend of increasing user load progresses.
Find the deviation of the performance metrics, such as reaction time, throughput, number of mistakes, etc., by comparing the outcome of each phase with the result of the preceding stage.
For an already-running application, run a test on the previous iteration of the code, establish baseline metrics, then deploy the most recent version of the code, run the test under the same load conditions, and compare the results to the baseline test results. The Baseline-Benchmark test strategy makes use of the ‘Compare’ method, which allows for an apple-to-apple comparison. If both tests were run with the same user load and scenario settings, the results of the baseline and benchmark tests may be compared.
How does the ‘Compare’ method help in analyzing the result?
Let’s take one example. There is one existing application that has a baseline test result from the previous release. During baseline test execution following were the NFRs:
No. of Users: 100
End to End Response Time: 40 seconds
TPS: 0.8 TPS
CPU Utilization: Below 70%
Java Heap Size: <500 MB
The most recent code base still adheres to the same NFRs, but we now have some extra data (from a baseline test) that will enable an apples-to-apples comparison.
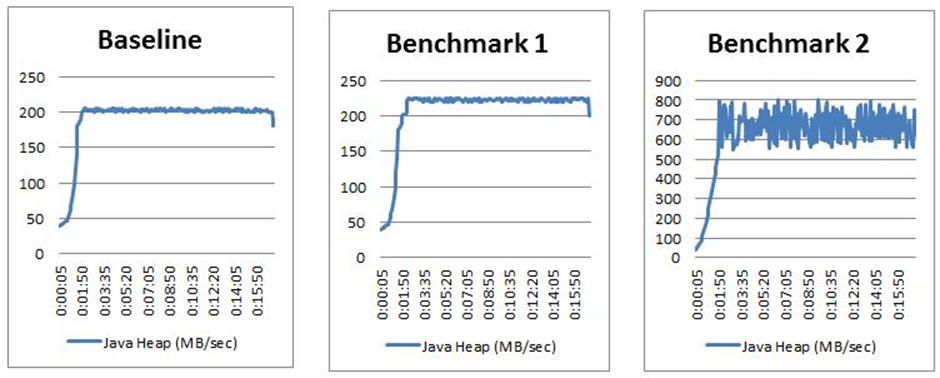
Referring to the graphs below, the first column shows the results of the baseline test, the second column the results of the Benchmark 1 test, and the third column the results of the Benchmark 2 test. Apply the comparison procedure now:
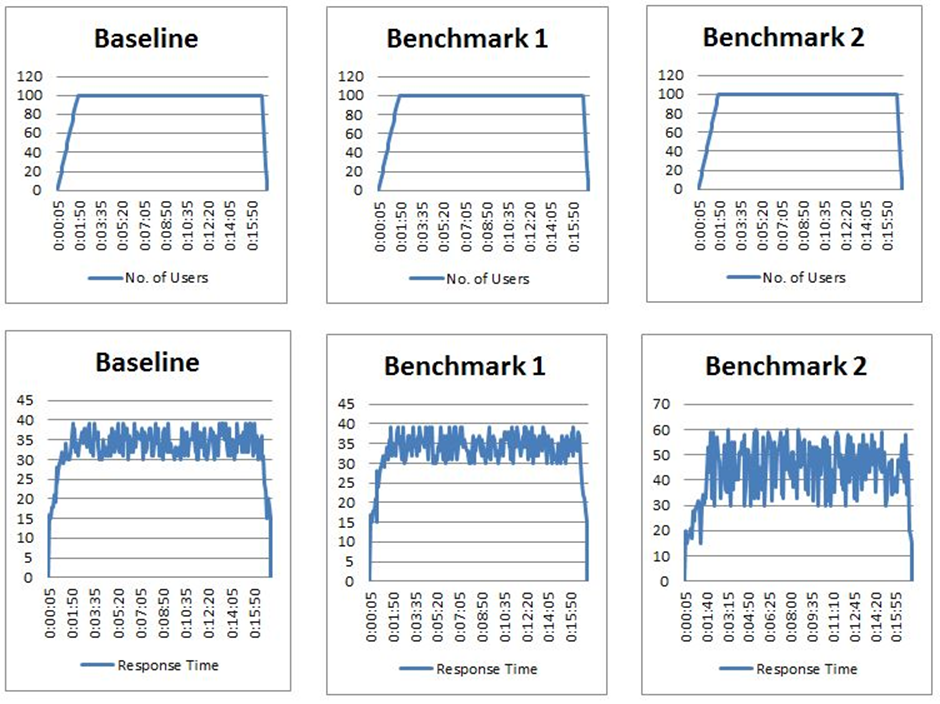
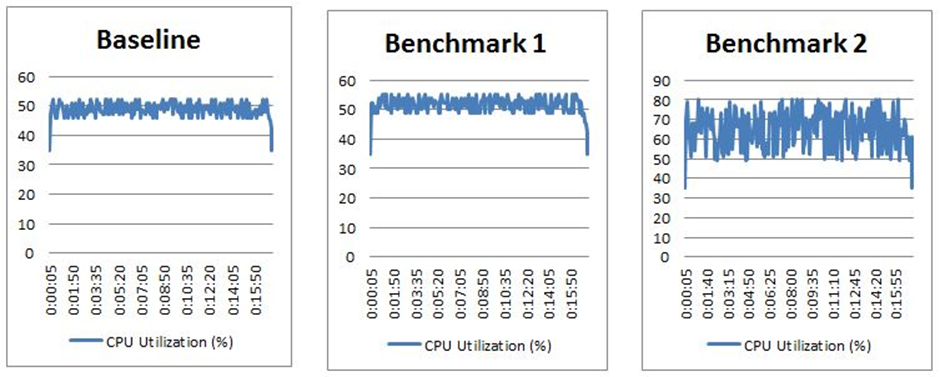

Understanding the permissible levels for the system and its resources and identifying what is noticeably different are both aided by the comparison of client and server performance measurements. Look for bottlenecks in the locations where the disparities arise.
We may thus infer that benchmark test result 1 fulfilled NFRs but benchmark test result 2 violated NFRs owing to the Java Heap Size problem, which needs more study to determine the precise underlying cause.
How to conclude the result?
You will learn which NFRs and baseline test results were fulfilled after comparing all the significant parameters. If the findings of your analysis fall within the acceptable range, you may quickly give a GREEN sign-off. Provide AMBER sign-off with the right risk and advice if some NFRs are broken (with low or no risk). Finally, if just a small number or none of the NFRs are met, give the RED sign-off and emphasize the dangers.