
Drill Down Method
By digging down to find the exact cause, you can focus on one problem area at a time and limit your attention to a single component. It is similar to starting your investigation at a general level and digging deeper to determine the precise nature of the problem. Any type of metric or component can be used in this approach. The comparison and correlation methods are also used in this method.
Let’s use an example to understand this approach:
Example
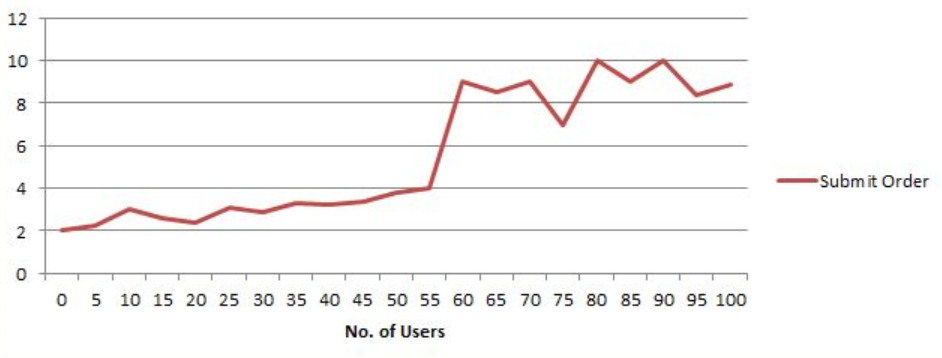
In a test I conducted with 100 users, the end-to-end response time suddenly increased when the number of users reached 60.
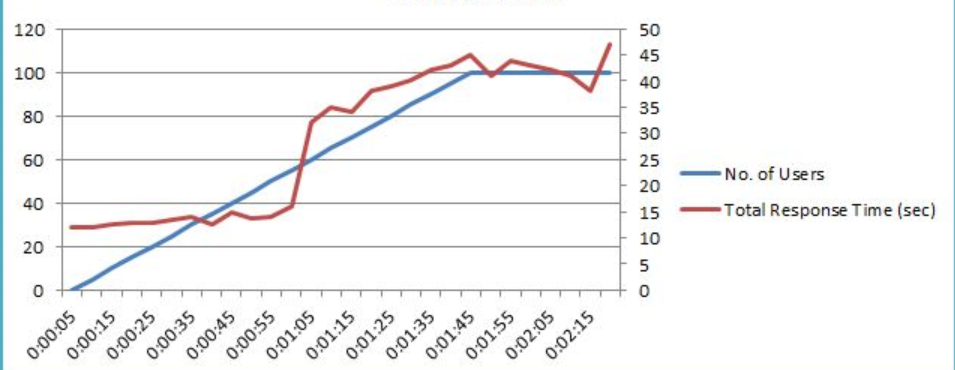
My next step should be to determine if a single transaction is causing the problem or if it is caused by all transactions. I look at the response time versus time graph or the average response time graph.
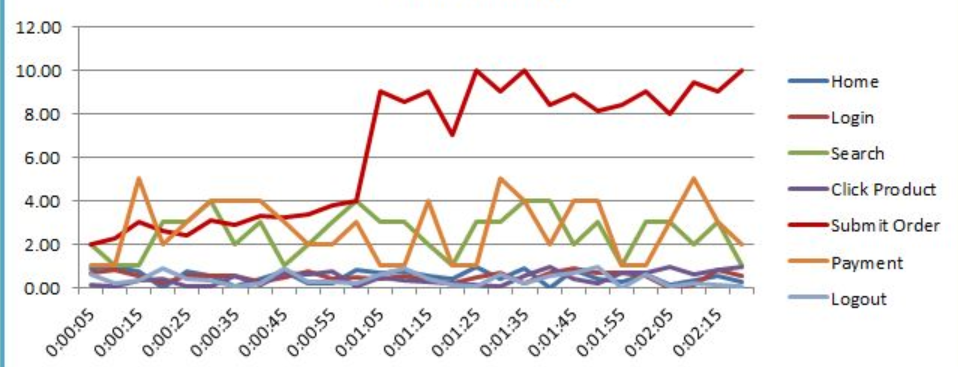
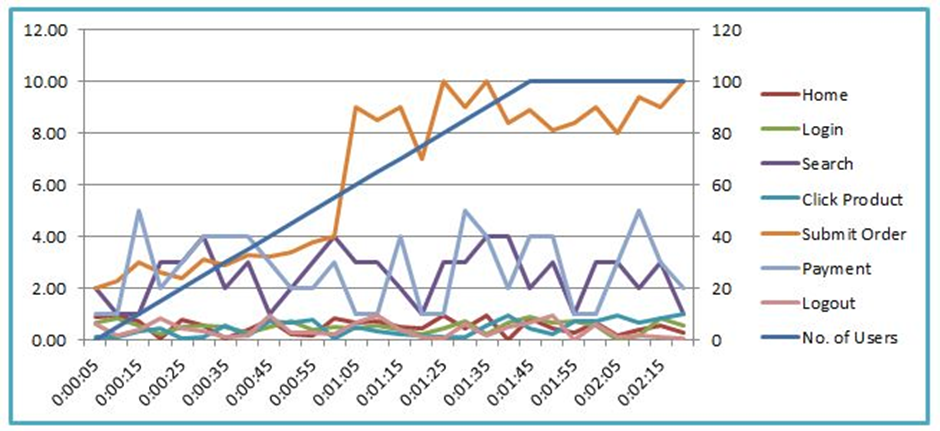
So this is the culprit. According to the graph above, the response time of the “Submit Order” transaction created a plateau at exactly the same time (0:00:55) when the number of users exceeded 60. Want to check? See the overlap and correlation charts below:
Method 3 to Break down
To find the true source of the problem, I now have to dig deeper. First, let’s look at the performance graph.
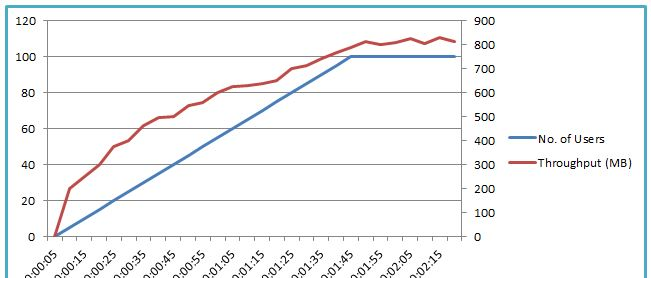
Performance seems fine and has not decreased. A high response time caused a small performance drop at the 55th second, but this does not indicate a network bottleneck. My research will now switch to the server side where the graphs will be parsed on the server side. Let’s take a look at the CPU usage graph:
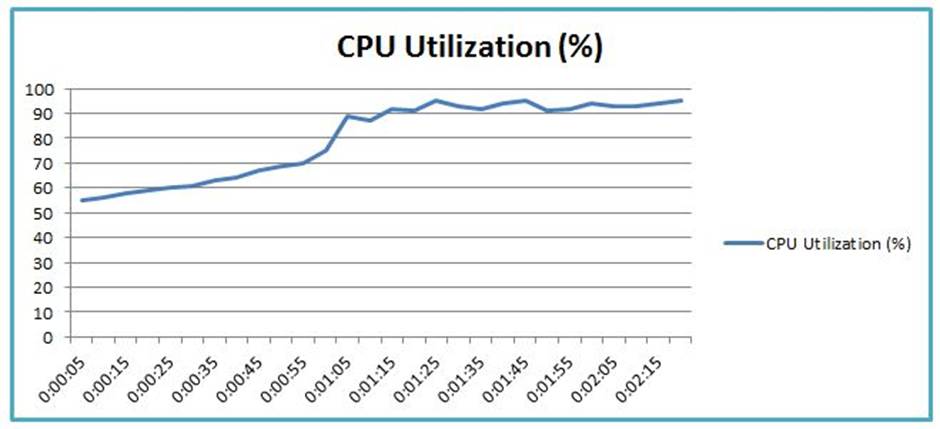
Yes, the CPU was getting more and more used, reaching 90% in the 55th second. Can you show us the graph of the Java heap?
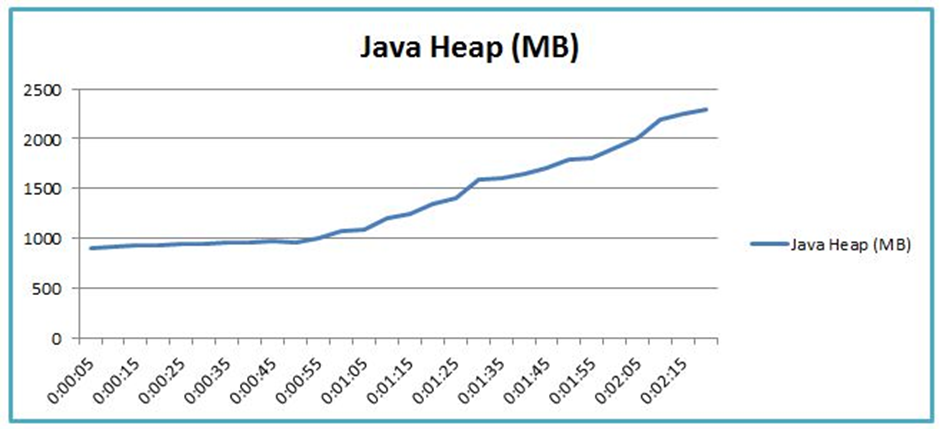
The heap size is growing, but will it continue to grow if all users are stable?
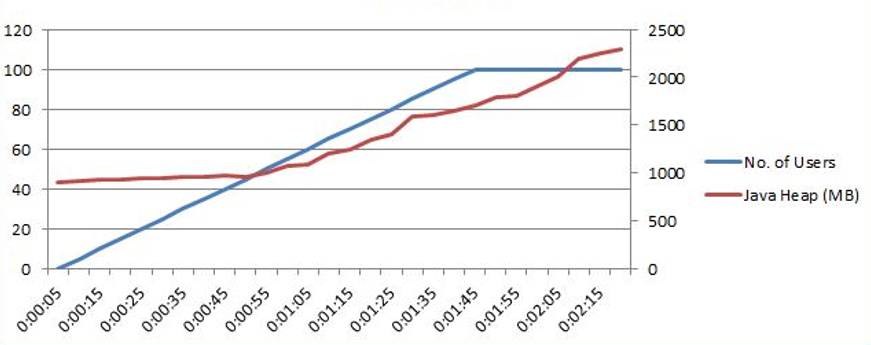
After overlaying the Java heap size graph and the number of users, the answer is yes. It is bottlenecked by the “Submit Order functionality” which produces new objects and takes up more and more heap space without freeing it up. Due to poor GC work, the heap size continues to grow.
By using some profiling tools to identify the exact name of the object, you can also dig into any performance issues and recommend developers to tweak the program by identifying the bottleneck.
Conclusion
the breakdown approach takes a bit more time than other approaches, but it reveals the exact source of the bottleneck. Therefore, performance engineers often use this technique to optimize the application.