
Importance of Standard Deviation in Performance Testing
Many performance testers pay less attention to standard deviation because they are unaware of its significance in performance testing. A crucial indicator of the stability of the application used in performance test result analysis is the standard deviation. Due to the complexity of the Standard Deviation computation and the likelihood of error when working with huge amounts of data. Additionally, calculating the standard deviation for a large number of datasets is highly challenging and time-consuming. To help you decide how the application will behave in real-time, several analysis tools calculate Standard Deviation and provide a summary.
After looking at the formula and methodology for computation, Standard Deviation appears to be fairly complicated. You learned about the significance of standard deviation in performance testing in the first section of this article. You will learn how to determine the Standard Deviation of supplied numbers in the subsequent section. (For a Performance Tester, that might not be necessary)
Definition:
Response time variance around the mean is quantified by the standard deviation. Simply said, the response time is more constant the lower the standard deviation.
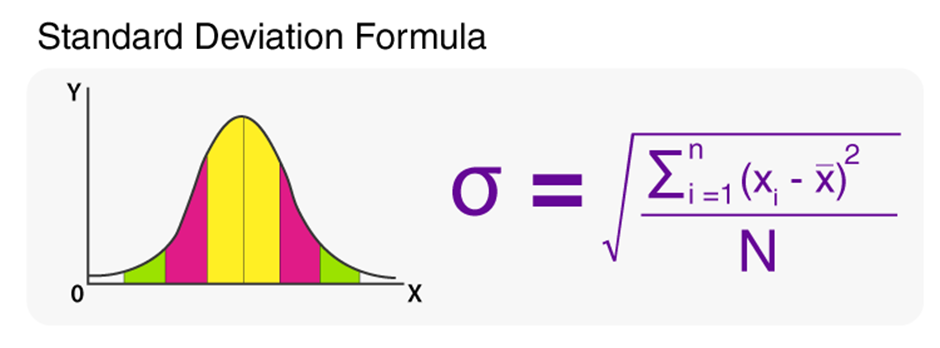
Formula:
Importance of Standard Deviation in Performance Testing
The standard deviation of your test indicates whether or not a given transaction’s reaction time is constant over the course of the test. The transaction response time will be more constant and you will feel more secure about a given page/request the lower the standard deviation. Just as crucial as providing a quick and responsive experience to the user is providing a consistent experience.
| Transaction Name | RT (I1) | RT (I2) | RT (I3) | RT (I4) | RT (I5) | Avg | SD | 90th %ile |
| Login | 4 | 6 | 3 | 4 | 8 | 5 | 2 | 6 |
| Search | 3 | 2 | 15 | 1 | 4 | 5 | 5.7 | 4 |
| Logout | 5 | 5 | 6 | 4 | 5 | 5 | 0.7 | 5 |
In the aforementioned illustration:
The averages are the same across all transactions. Average reaction times are meaningless in performance testing, thus you cannot infer from them that the test findings were successful.
Although the “Search” transaction’s 90th percentile performance is superior to the other two, you can see that I3’s response time is 15 seconds. It is true that we view percentile values as crucial metrics, but they are not the only ones. You must also determine how much the response time is off.
The transaction that has the lowest Standard Deviation (0.7) is “Logout”. It demonstrates that reaction times are more reliable than the other two, and it is accurate to say that there is very little variation in the “Logout” response time of 5, 5, 6, 4, 5. Its 90th percentile is five, too.
We now have our top performer (Logout), and we need to look at the two other requests (Login and Search) for adjustment.
Calculation of Standard Deviation:
Because you will be looking for a tool that calculates Standard Deviation quickly and accurately while saving you time, it is unnecessary to explain how it is computed. However, if you’re curious about how Standard Deviation is calculated, follow these steps:
Determine the mean (the arithmetic mean of the numbers).
Square the result after removing the Mean from each integer.
Total all the numbers, then divide by N-1.
Take that’s a square root. You are the Standard Deviation.