
Latency, Bandwidth, Throughput, and Response Time
The phrases latency, throughput, bandwidth, and response time are all somewhat muddled. Without examples, it might be challenging for a fresh performance tester to comprehend these phrases. The understanding of network latency, network bandwidth, data throughput, and response time will be helped by reading this article.
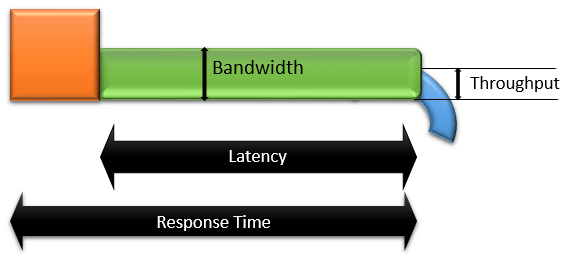
Latency:
Latency is the length of time it takes for water to go from one end to the other. Milliseconds, seconds, minutes, or hours can be used as measurement units. The word latency (or more accurately, network latency) in performance testing refers to the amount of time it takes for a request to go between a client and a server and back again. ‘Network Delay’ was the name given to it by some testers. We’ll say:
- A request starts at t=0
- Reaches a server in 1 second (at t=1)
- The server takes 2 seconds to process (at t=3)
- Reaches to the client end in 1.2 seconds (at t=4)
Bandwidth:
The capacity of the communication channel is indicated by the bandwidth. The amount of water that can fit through the pipe at its maximum is shown. The greatest quantity of data that can be sent across a communication channel in a given length of time is referred to as the channel’s bandwidth in performance testing. Consider an ISDN with 64Kbps of capacity. By adding a second 64Kbps channel, the bandwidth will grow to 128Kbps, allowing for a maximum of 128Kbps of data transfer across the ISDN channel.
Throughput:
‘Throughput’ is a representation of the water output from the pipe. Data throughput is defined as “the amount of data moved successfully from one place to another in a given time period” in the context of performance testing. Bits per second (bps), such as megabits per second (Mbps) or gigabits per second (Gbps), are the standard units of measurement. Assuming that 20 bits of data are sent at t=4, the throughput at t=4 is 20 bps.
Response Time:
Response time is the interval between when a user submits a request and when the application notifies the user that the request has been fulfilled and returned. Response time in the Latency example will be 4 seconds.
Several things to bear in mind are as follows:
- More problems can be solved with bandwidth than with delay.
- When throughput and bandwidth are almost identical, the network’s entire capacity is being used, which might cause network bandwidth problems.
- A flat throughput graph and an increase in response time indicate a network bandwidth problem. By adding additional channels, or boosting network capacity, this bottleneck can be solved.
- Consistent throughput, in theory, reflects a network’s anticipated bandwidth capability.
- Some tools describe throughput in clock periods rather than units per unit of time. Despite being erroneous, this is widespread usage due to its practicality.
- When users are ramping up, response time should ideally be proportionate to throughput. When reaction time increases while throughput declines, the application or system is unstable.
- In a steady state, reaction time and throughput should ideally remain constant. The stability of the application is shown by a lower variation in both terms.
- The throughput is directly inversely correlated with the number of threads.
- Data will move from point A to point B more slowly with low latency and small bandwidth compared to a link with low latency and high bandwidth.
- Type of connection, distance, and network congestion all have an impact on latency.