
Network-side Result Analysis
The examination of network-side performance results is a follow-up to my prior articles on client and server performance analysis and optimization (Performance Test Result examination Basic Level and Performance Test Result Analysis Intermediate Level). Once you have evaluated the client- and server-side performance but are still not satisfied, consider the network performance.
When you’re ready to look at the different parts of the network, start by examining the network’s throughput, bandwidth, and latency. Visit my article Why so confused with Latency, Bandwidth, and Throughput for additional details regarding these three crucial metrics.
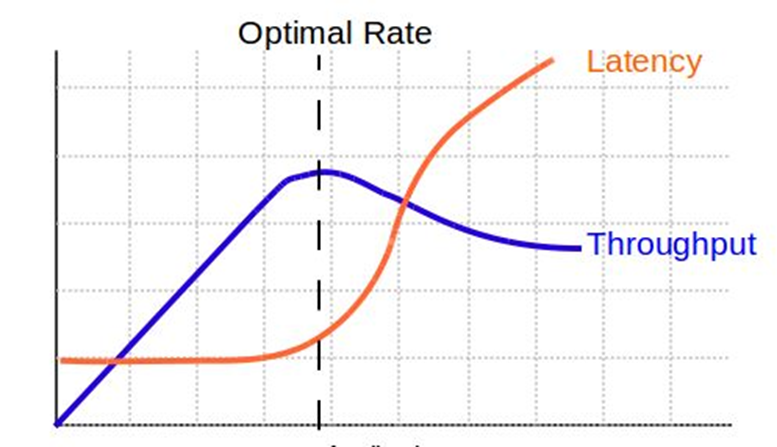
A frequent limitation that may be located by examining latency and throughput graphs is network capacity in general. Refer to the graph below, which depicts a common network bandwidth bottleneck:
In order to accelerate the transmission of requests and replies between the client and server, network gear is also crucial.
Use adapters that offer task offloading features, such as checksum offloading, IP Security (IPSEC) offloading, or big send offloading, as well as interrupt moderation to get the most out of Windows 2000 networking speed improvements.
What are the common Network Bottlenecks?
- Client-network interface
- Server network interface
- Network bandwidth
- Network topology
- Inefficient configuration
How to identify Network Performance bottlenecks?
You must examine the Network latency graph by fusing it with the throughput graph in order to identify network performance concerns, particularly bandwidth difficulties. If throughput improves but latency does not, the problem is likely with the network bandwidth. Refer to the illustration below:
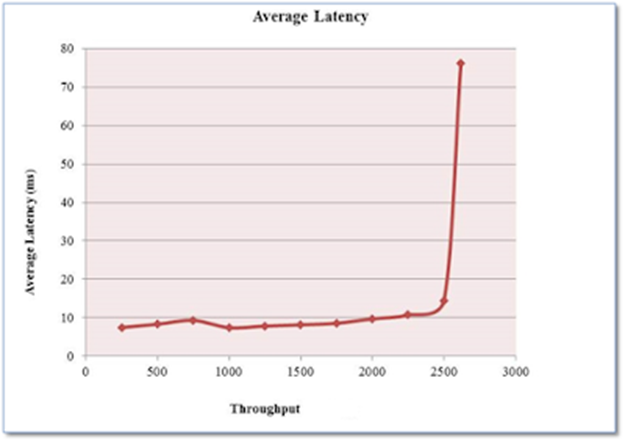
A fair Throughput vs latency graph is given below which shows sufficient network bandwidth:
Network Monitoring Tools
There are many tools that could be used to monitor network performance and identify the issue. I have listed some of the tools below:
- Free Website Monitor
- Microsoft Network Monitor
- OpenNMS: Open Source
- Nagios: Open Source
- Fiddler
- Wireshark
- SolarWinds
What are the Counters for Network Monitoring?
Some of the generic network performance counters are:
Network Bandwidth
Network Utilization (%)
Server – Bytes Received/sec
Server – Bytes Sent/sec
Packets Received/sec
Packets Sent/sec
Output Queue Length
Packets dropped/sec
IP – Datagrams Received/sec
IP – Datagrams Sent/sec
Dropped Datagrams/sec
Additional Counters:
- UDP
- Segments Received/sec
- Segments Sent/sec
- TCP
- Frames Sent/sec
- TCP – Frames Received/sec
- Packets
- Outbound Discarded
- Outbound Errors
- Received Discarded
- Received Errors
Some important points to be remembered:
More problems can be solved with bandwidth than with delay.
When throughput and bandwidth are almost identical, the network is operating at maximum capacity.
A flat throughput graph and an increase in response time indicate a network bandwidth problem. By introducing more channels, or by boosting network capacity, this bottleneck can be resolved.
Ideal throughput represents a network’s anticipated bandwidth capacity.
It will take longer for data to go from point A to point B if you have low latency but low bandwidth compared to a connection with low latency and high capacity.
Connection type, distance, and network congestion all have an impact on latency.