This is a technique for deciphering chart patterns by examining and contrasting them before drawing a conclusion. This method consists of two components:
- pattern recognition
- Pattern Comparison
A soak test, which helps identify memory leaks in the application, is the best illustration of the pattern method. In the soak test or endurance test, a system is tested under an average load over a considerable period of time. Here your goal is to learn how the system works with prolonged use. That is, to ensure that performance and/or response times are as good or better than at the beginning of the test. Typically, the duration of the stress test
Pattern analysis:
A performance tester examines the pattern in the graph to see if the program will still work. This begins the first phase of the pattern method. You should understand the pattern of GC response time, performance, CPU usage, memory usage, and graphics in this section. An investigation is driven by a spike or an irregular pattern.
Pattern Comparison
is the topic of the second part. In this approach, we contrast performance problems on the system under review with typical problems and their root causes on other systems.
There are numerous typical performance issues, such as server configuration issues, load balancer issues, web server cache refresh, and memory leaks, all of which can cause response times to increase frequently or even dramatically on unreliable systems. Finding the root cause begins with a comparison of performance issues with typical problems. This makes it quick and easy to resolve common issues identified.
Sample pattern method:
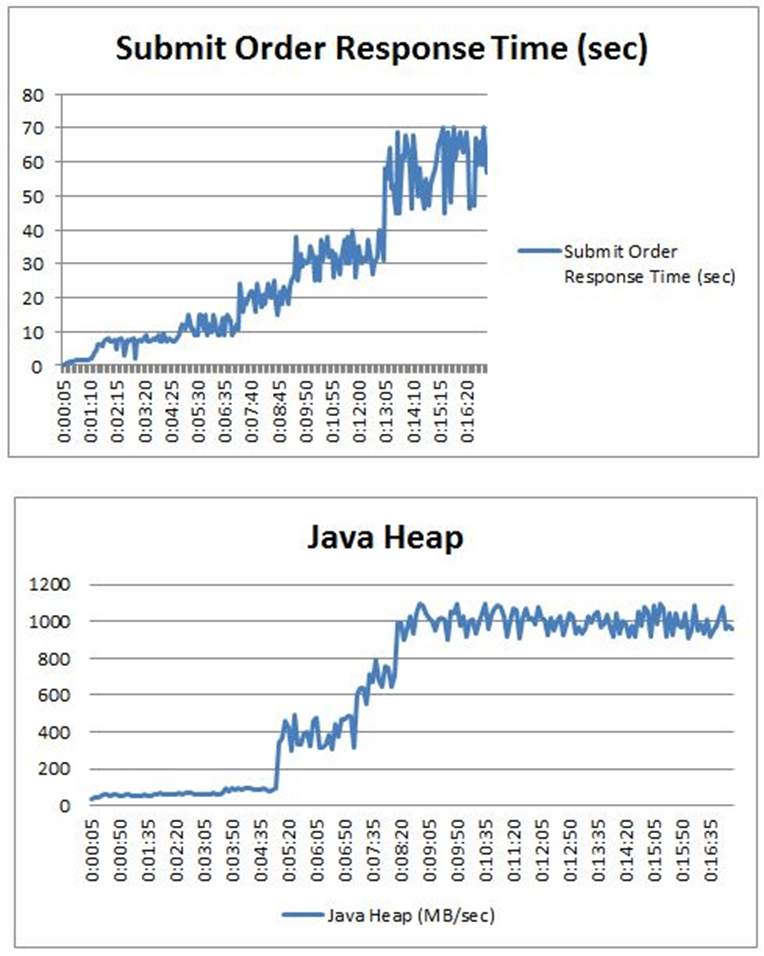
Let’s look at a test result of a Java-based order management system with 1,000 orders per hour for 24 hours to better understand this strategy. At the beginning of the test, the response time for the Submit Order transaction was only a few seconds, but it began to increase rapidly, eventually reaching 70 seconds. The average transaction response time graph shows that performance has clearly decreased over time. Based on Pattern’s approach, the root cause of the problem, in this case, could be memory shortage over time. Java memory usage analysis revealed an increase in used memory from 90 MB to 1 GB.


