
A UI performance test metric called the Speed Index (SI) measures how quickly the content of a web page is visually displayed to end users. The speed index is not, in fact, a time-based measure. The score represents how quickly the content of a web page loads. The performance of that web page improves with decreasing SI values.
How is the speed index calculated?
The rate of speed can be calculated very easily, but the UI tool determines what time interval is used to capture the visual frames. Until the page is complete visually, the UI tool keeps track of the percentage of the page that is complete visually.
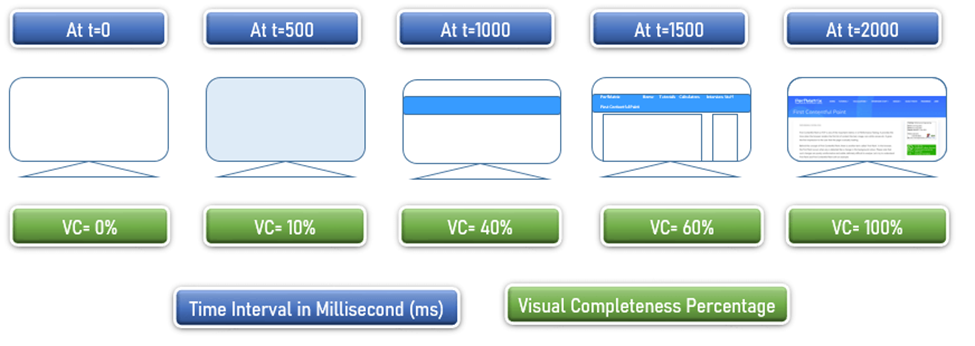
Let’s use an example to understand how the speed index is calculated. See the image below, which shows 5 frames from a website. The UI tool records the loading screen of the website at predetermined intervals (ie 500ms) and using some internal logic determines the percentage of visual completion at that point.
The speed index formula is
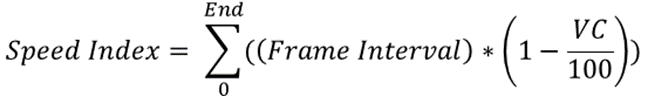
Speed Index – Formula
Now put the values in the above formula:
500 * (1-(0/100)) = 500
500 * (1-(10/100)) = 450
500 * (1-(40/100)) = 300
500 * (1-(60/100)) = 200
500 * (1-(100/100)) = 0
Speed Index = 500 + 450 + 300 + 200 + 0
Speed index = 1450
What SI value would be ideal?
The SI is calculated using different time interval frames using user interface tools, as mentioned above. As a result, the range of values also differs. The Google Lighthouse speed index standard is:
| Speed Index (in milliseconds) | Considered As | Colour Coding |
| 0 to 3400 | Fast | Green |
| 3400 to 5800 | Moderate | Orange |
| Over 5800 | Slow | Red |
How can you increase the speed index score?
You can increase your SI score by using the following strategies:
- JavaScript needs to be improved to speed up execution.
- Stop using Javascript.
- Use a slow image loader
- Progression-Based Image Logic
- Create cache hierarchy
- Optimize font and images.
Can SI value be False?
Yes, please note that the following two websites have visual integrity values:
| Time Interval (in ms) | VC of Website A | VC of Website B |
| 0 | 0% | 0% |
| 500 | 10% | 5% |
| 1000 | 30% | 10% |
| 1500 | 60% | 90% |
| 2000 | 100% | 100% |
| SI Score | 1500 | 1475 |
Table 02
Which website is faster than the other, since all the contents of both websites are loaded simultaneously (ie in t = 2000 ms) and are visible to the users?
Website A has an SI score of 1500, while Website B has a score of 1475. Based on the SI score, you could argue that Website B is faster than Website A, but this is not entirely true. exact. Due to the slowly progressive nature of Website A, the user would consider it faster than Website B, which loads most of the content abruptly at the end.
The SI is often seen as a subjective and illustrative measure rather than decisive. The SI metric alone cannot determine if a website is trustworthy.