Steps to Design Workload Model in Performance Testing
The last post (Performance Test Workload Modelling) covered the fundamentals of workload modeling as well as the tasks involved in this stage. The design of Performance Test Scenarios is another name for this stage. Let’s use some real-world examples to try to comprehend this phase. This article will outline the procedures for creating a workload model for performance testing.
NFRs are pasted below:
| NFR ID | Category | Description | Impact to |
| NFR01 | Application | The solution must be able to support 500 active users. 1. Admin: 4 (2 for seller and 2 for product approval) 2. Seller: 50 3. Buyer: 438 4. Call Center: 8 | 1. Admin 2. Seller 3. Buyer 4. Call Center |
| NFR02 | Application | The solution must be able to support the future volume of active users i.e. 2634 1. Admin: 10 2. Seller: 100 3. Buyer: 2500 4. Call Center: 24 | 1. Admin 2. Seller 3. Buyer 4. Call Center |
| NFR03 | Application | The solution must be performed well during a long period of time with average volume. i.e. 304 1. Admin: 3 2. Seller: 15 3. Buyer: 278 4. Call Center: 8 | 1. Admin 2. Seller 3. Buyer 4. Call Center |
| NFR04 | Application | The solution must be able to support the spike load of the buyer and seller during the sale period. 1. Admin: 3 2. Seller: 23 3. Buyer: 834 4. Call Center: 8 | 1. Admin 2. Seller 3. Buyer 4. Call Center |
| NFR05 | Application | Admin gets an average of 200 requests per hour every time. | 1. Admin |
| NFR06 | Application | The number of orders: 1. Peak Hour Volume: 1340 2. Sale Hour Volume: 2830 3. Future Volume: 7500 4. Average Volume: 600 Note: 4% of the users cancel the order in every scenario. | 1. Buyer |
| NFR07 | Application | Sellers add an average of 180 products per hour and delete 18 existing products every hour | 1. Seller |
| NFR08 | Application | The call center employees get 40 complaints per hour | 1. Call Center |
| NFR09 | Application | The response time of any page must not exceed 3 seconds except stress test | 1. Admin 2. Seller 3. Buyer 4. Call Center |
| NFR10 | Application | The error rate of transactions must not exceed 1% | 1. Admin 2. Seller 3. Buyer 4. Call Center |
| NFR11 | Server | The CPU Utilization must not exceed 60% | 1. Web 2. App 3. DB |
| NFR12 | Server | The disk Utilization must not exceed 15% (Compare pre, post, and steady-state memory status) | 1. Web 2. App 3. DB |
| NFR13 | Server | There must not be any memory leakage | 1. Web 2. App 3. DB |
| NFR14 | Server | There must not any memory leakage | 1. Web 2. App 3. DB |
| NFR15 | Application | Buyers order at the average rate of 1. Peak Hour Rate: 3.06 products per hour 2. Sale Hour Rate: 3.39 products per hour 3. Future Volume: 3 products per hour 4. Average Volume Rate: 2.15 products per hour | 1. Buyer |
Steps to Design an efficient workload model in Performance Testing:
Load Test must have 500 users load. Hence the load distribution among the scripts as per NFR01 is:
| Role | User Count | Script Name | User Distribution |
| Admin | 4 | adm_seller_request | 2 |
| adm_product_request | 2 | ||
| Seller | 50 | slr_add_product | 45 |
| slr_delete_product | 5 | ||
| Buyer | 438 | byr_buy_product | 420 |
| byr_cancel_order | 18 | ||
| Call Center | 8 | cce_register_complain | 8 |
Calculation of User distribution:
- According to NFR01, two administrators are in charge of product approval and two administrators are in charge of seller approval. As a result, the user count is split 50/50. Two users will run the adm_seller_request script during the test, and two more users will run the adm_product_request script.
- According to NFR07, 10% of all sellers will delete products, thus 5 merchants (or 10% of 50) will do this using the slr_delete_product script, while the other 45 sellers will use the slr_add_product script to add new products.
- According to NFR06, 4% of all customers cancel orders. Therefore, 18 buyers (rounded up to 4% of 438) will use the byr_cancel_order script to cancel their purchases, and the remaining 420 buyers will use the byr_buy_product script to place their orders.
- There will be no distribution in the contact center scenario since all 8 call center employees would perform the same duty.
Get the Iterations per second metric:
Obtaining the iterations per second value is the following step. The iteration count, which is accessible in NFR05, NFR06, NFR07, and NFR08, can be provided by the request or order count. Divide the iteration count by 3600 to obtain the iterations per second statistic (only when the iteration count is expressed in hours).
| Role | User Count | Script Name | User Distribution | Requests/Orders per hour (Iterations per hour) | Iteration per second = Iteration per hour / 3600 |
| Admin | 4 | adm_seller_request | 2 | 100 | 0.028 |
| adm_product_request | 2 | 100 | 0.028 | ||
| Seller | 50 | slr_add_product | 45 | 180 | 0.05 |
| slr_delete_product | 5 | 18 | 0.005 | ||
| Buyer | 438 | byr_buy_product | 420 | 1340 | 0.372 |
| byr_cancel_order | 18 | 54 | 0.015 | ||
| Call Center | 8 | cce_register_complain | 8 | 40 | 0.011 |
| Total | 500 | 500 | 1832 | 0.51 |
Get the number of transactions metric for each script:
| Role | User Count | Script Name | User Distribution | Request/Order per hour | No. of transactions in each iteration |
| Admin | 4 | adm_seller_request | 2 | 100 | 7 |
| adm_product_request | 2 | 100 | 7 | ||
| Seller | 50 | slr_add_product | 45 | 180 | 7 |
| slr_delete_product | 5 | 18 | 7 | ||
| Buyer | 438 | byr_buy_product | 420 | 1340 | 8 |
| byr_cancel_order | 18 | 54 | 6 | ||
| Call Center | 8 | cce_register_complain | 8 | 40 | 7 |
| Total | 500 | 500 | 1832 |
Get the End-to-End Response Time metric:
The end-to-end response time is the next thing to determine. End-to-end response time in this context refers to the time needed to finish one loop. The response time measure is initially undefined or intended rather than actual. The performance tester must now run each script for a single user to determine the response time. The reaction time recorded by playing the script again might not match the response time recorded during the test. If yes, this could affect the metrics for the anticipated number of iterations. A performance tester must devise 1 sanity test to record the real reaction time in order to avoid such a predicament. The likelihood of over- or under-hitting the server increases if he executes the script without accounting for response time.
The main purpose of the sanity test is just to get the end-to-end response time. This test could be run without Think Time or pacing.
| Role | Script Name | End to End Response Time (in seconds) |
| Admin | adm_seller_request | 15 |
| adm_product_request | 15 | |
| Seller | slr_add_product | 18 |
| slr_delete_product | 10 | |
| Buyer | byr_buy_product | 51 |
| byr_cancel_order | 34 | |
| Call Center | cce_register_complain | 29 |
Calculation of Think Time metric:
PerfMate executed the scripts and calculated the total response time for each test scenario. The scripts were performed without the use of Think Time, hence they did not represent actual events. PerfMate must add thought time between each step (transaction) in order to make the scenario real-time. He can make assumptions about time based on the information or actions taken by users on a given page. The amount of time between two pages indicates that a user paused on the previous page to read the content, fill out the form, or wait for the entire page to load, among other things. Depending on the parameters of the performance testing instrument, it could be random or fixed.
So the total think time will be:
| Role | Script Name | No. of Transactions | Think Time (in seconds) | Total Think Time = Think Time*(No. of Transactions-1) |
| Admin | adm_seller_request | 7 | 3 | 18 |
| adm_product_request | 7 | 3 | 18 | |
| Seller | slr_add_product | 7 | 3 | 18 |
| slr_delete_product | 7 | 3 | 18 | |
| Buyer | byr_buy_product | 8 | 3 | 21 |
| byr_cancel_order | 6 | 3 | 15 | |
| Call Center | cce_register_complain | 7 | 3 | 18 |
Total Think Time = Individual Think Time * (No. of Transactions – 1)
If the think time values are different between each transaction then simply sum up all the think time values to get the total think time.
Total Think Time = (Think Time 1) + (Think Time 2) + (Think Time 3) + …….. + (Think Time N)
Calculation of Pacing metric:
Pacing = (No. of Users / Iterations per second) – (End to End Response Time + Total Think Time)
| Role | Script Name | No. of Users | Iterations per second | End-to-End Response Time | Total Think Time | Pacing |
| Admin | adm_seller_request | 2 | 0.028 | 15 | 18 | 38.42 |
| adm_product_request | 2 | 0.028 | 15 | 18 | 38.42 | |
| Seller | slr_add_product | 45 | 0.05 | 18 | 18 | 864 |
| slr_delete_product | 5 | 0.005 | 10 | 18 | 972 | |
| Buyer | byr_buy_product | 420 | 0.372 | 51 | 21 | 1057 |
| byr_cancel_order | 18 | 0.015 | 34 | 15 | 1151 | |
| Call Center | cce_register_complain | 8 | 0.011 | 29 | 18 | 680.27 |
Decide Steady State, Ramp-up & Ramp-down Time:
According to PerfProject’s Performance Test Plan, a load test’s steady state period lasts an hour when all users are ramped up. The number of users in a certain situation is used to determine the ramp-up time. PerfMate takes into account the following delay, ramp-up, steady state, and ramp-down times in this case. The only thing to bear in mind is that, in a situation involving several scripts, each script should enter a steady state simultaneously in order to apply the required load at the same time and assess the application’s genuine performance.
| Script Name | No. of Users | Initial Delay (in minutes) | Ramp-up | Steady state (in minutes) | Ramp-down |
| adm_seller_request | 2 | 9 | 1 User per minute | 60 | 1 User per minute |
| adm_product_request | 2 | 9 | 1 User per minute | 60 | 1 User per minute |
| slr_add_product | 45 | 6 | 9 Users per minute | 60 | 10 Users per minute |
| slr_delete_product | 5 | 8 | 2 Users per minute | 60 | 1 User per minute |
| byr_buy_product | 420 | 0 | 20 Users per 30 sec | 60 | 30 Users per 10 sec |
| byr_cancel_order | 18 | 6 | 4 Users per minute | 60 | 6 Users per minute |
| cce_register_complain | 8 | 6 | 2 Users per minute | 60 | 4 Users per minute |
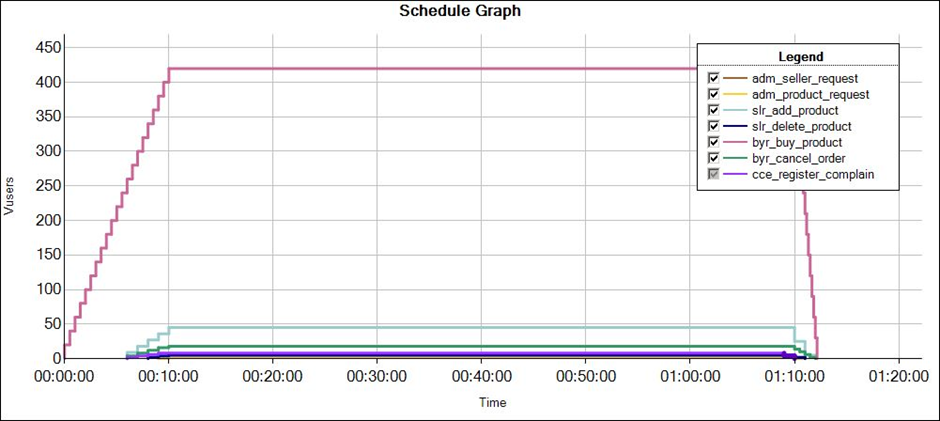
PerfProject’s workload model for Load Testing:
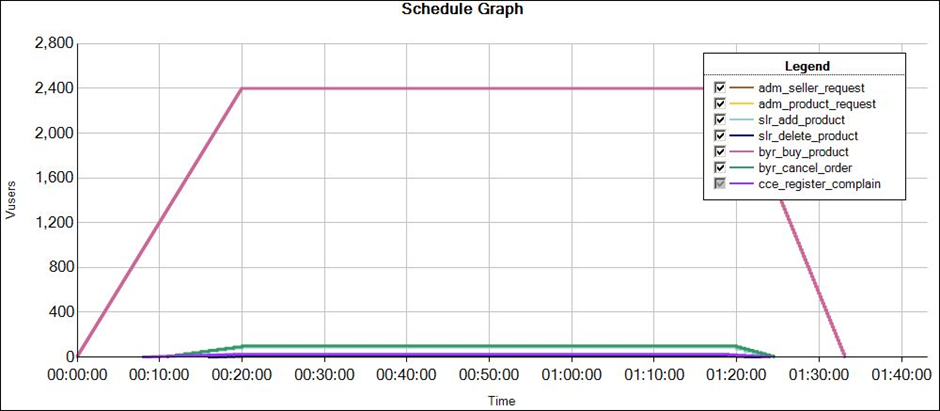
PerfProject’s workload model for Stress Testing:
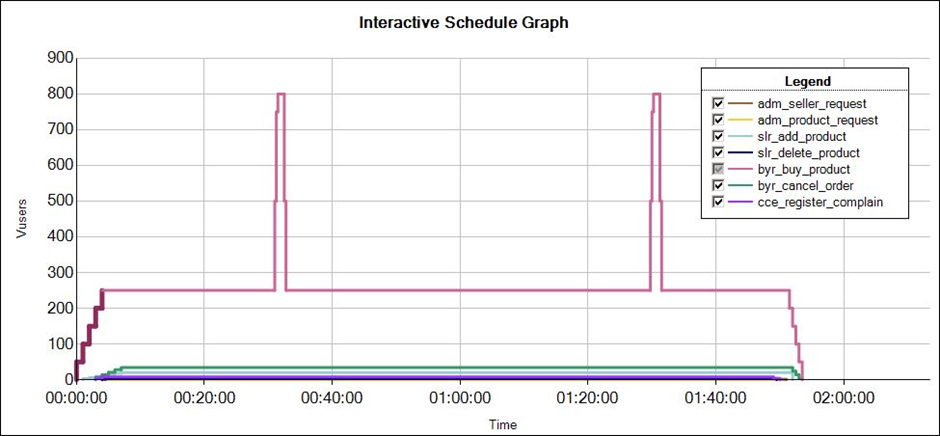
PerfProject’s workload model for SpikeTesting:
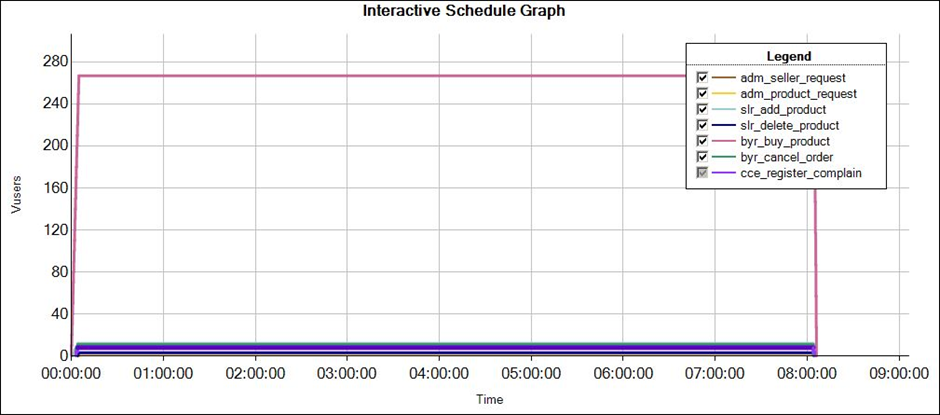
PerfProject’s workload model for Endurance Testing: