
It is an online open-source tool. To investigate Threads and determine the underlying source of the problem, a number of thread dump analysis tools are available. I discovered two excellent thread dump analyzers among them.
Tools for Thread Dump Analysis:
- fastThread: is an online tool for analyzing thread dumps. It features a straightforward dashboard view. FastThread makes it possible to inspect blocked, runnable, timed, waiting, and repeated stack traces in detail. Any language that runs on the JVM can have its thread dumps parsed and analyzed by fastThread. Another benefit is that you can instantly check the reports with a single click after uploading the application thread dump files.
- jstack.review: Another online thread dump analyzer is jstack. review. The additional feature of this application allows you to paste the thread dump file’s content in the provided thread dump section and analyze it if you have trouble uploading the thread dump file. Additionally, it provides the possibility to contrast and evaluate the dumps.
We’ll use the ‘fastThread’ tool to help us understand the thread dump analysis practically. With the use of the fastThread tool, we’ll explore how to spot deadlocks, blocked threads, waiting threads, etc. Each thread’s condition and detailed details are provided via the fastThread utility. It examines the thread dump file and assists in identifying any deadlocks or other critical problems.
How can I use fastThread to analyze a Thread Dump?
Step 1: Open the website http://fastthread.io

Figure 01, the home page for the fast thread
Step 2: Use the “Choose File” option to browse the thread dump file (.zip, .gz, or .tdump format).
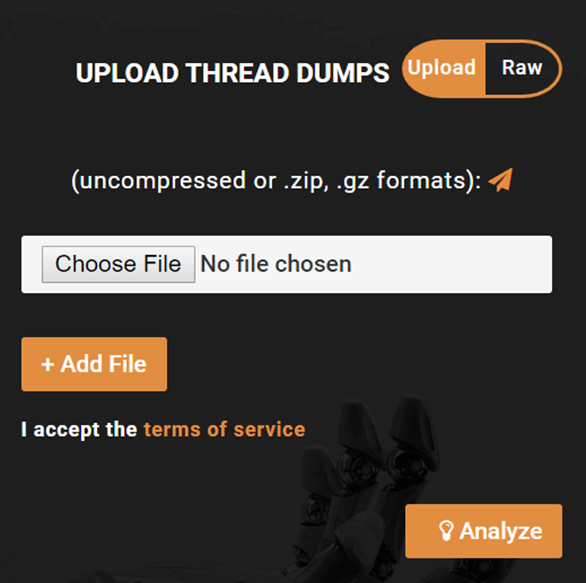
Figure 02: File Dump Thread
Step 3: of the Upload Thread Dump. Select “Analyze” from the menu. As shown in Figure 03, you can see that the file “Uploading” is currently happening.
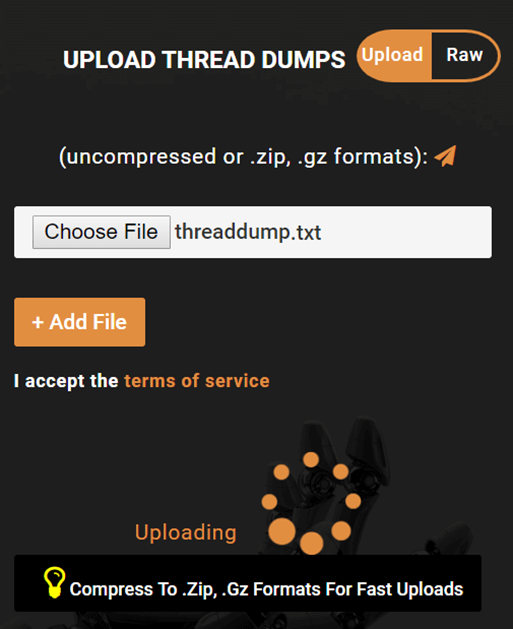
Figure 3:File uploading is ongoing
Step 04: After selecting “Analyze,” fastThread scans and analyzes the dump for a few seconds before setting up the dashboard.

Figure 04: Thread Dump scanning and analysis
Step 05: After step 04 has been completed, fastThread displays the outcome of the thread dump analysis. The dashboard’s right pane contains a detailed view of each tab while the left pane displays a number of tabs. The output gives you full information about each thread and any issues that were found, including a thread count summary, an identical stack trace, the most popular methods, CPU threads, and GC threads.
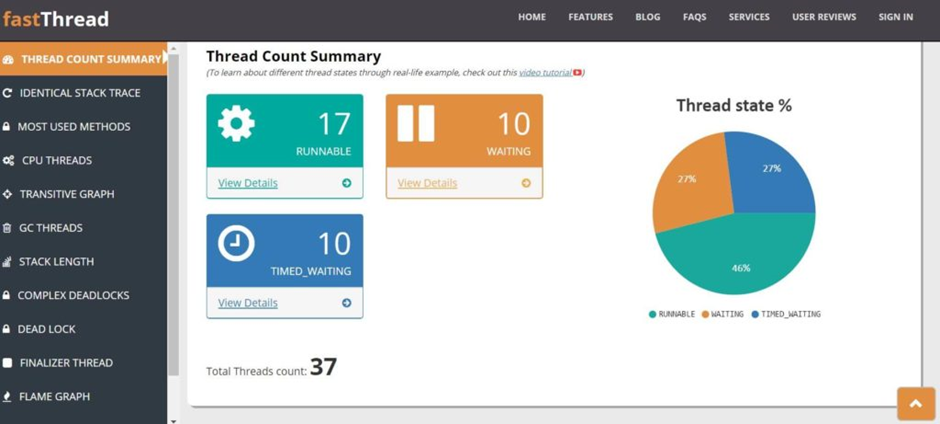
Figure 05: FastThread Dashboard
Thread Dump Analysis:
Both in the test and production environments, there are a variety of potential outcomes. In this section, we’ll go over a few typical and significant situations that will help you understand how to pinpoint the problem and wrap up the inquiry.
At the conclusion of each scenario, we’ll also receive some advice.
We will divide the analysis into 3 possibilities for easier understanding, which are:
- Normal situation
- Block Thread Example
- Deadlock Hypothesis
Normal Situation
Therefore, let’s begin with a Normal scenario in which every thread is operating without any problems. Refer to the fastThread dashboard’s
Thread Count Summary
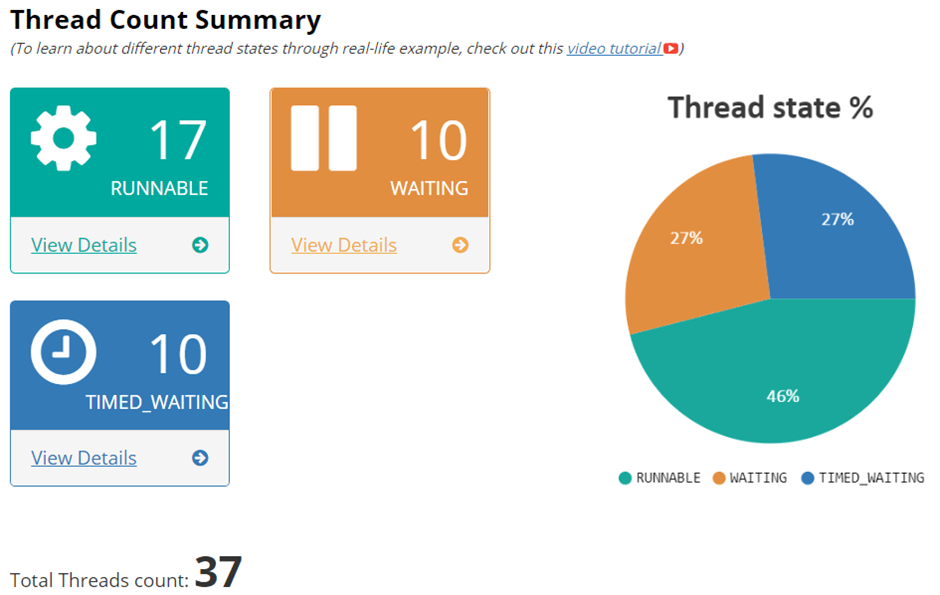
Summary of thread counts Figure 06: Summary of thread counts
Due to a shortage of resources, none of the threads are blocked. There are 17 active threads. 10 threads were waiting for their chance to execute or a response from another thread’s execution while the resources were locked. The remaining 10 threads are either put to sleep, parked, or forced to wait using the appropriate techniques.
The pie chart (seen on the right) displays the same data in percentage form.
For further details about any topic, click “View Details”.
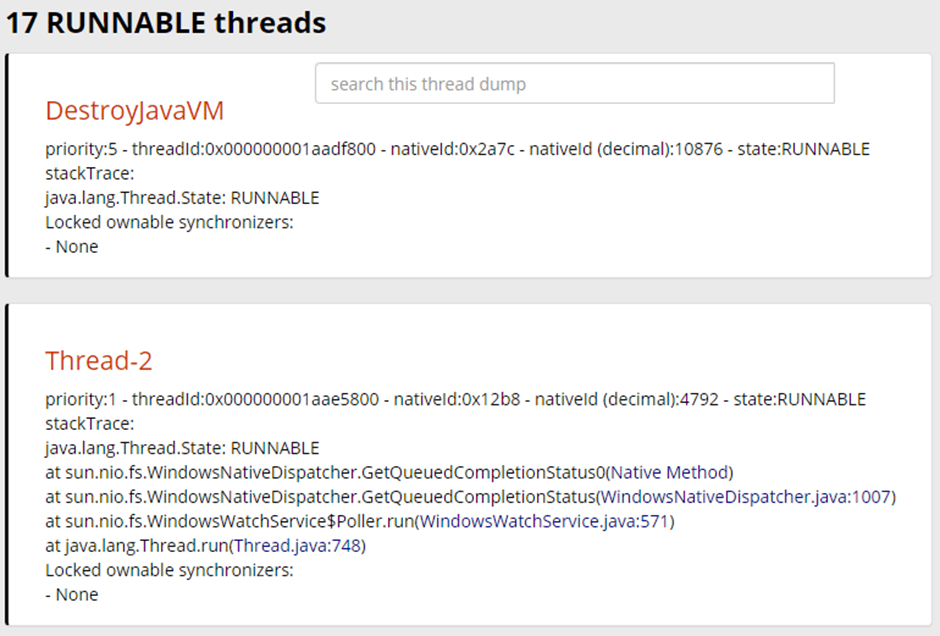
Figure 7: Thread information
As previously established, there is no blocked thread, hence there is no transitive graph.
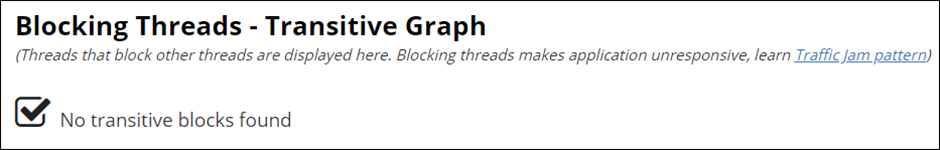
Figure 08: transitive graph.
Deadlock Identification: Recognizing a deadlock in a transitive graph Take a look at the Dead Lock tab. FastThread did not detect any deadlocks, as was discovered. Look below:

Figure 09: A stalemate
Conclusion:
There are no problems or resource shortages with any of the threads; they are all functioning properly. Therefore, no blocked threads or reported deadlocks were detected.
Advice:
If you’d rather manually analyze the dump than use fastThread, take the following actions:
Step 1: Launch Notepad++ and open the thread dump file.
2. Examine the first thread to get the resource ID that was locked by it. Example: The resource 0x00000000f03eb540 was frozen by the Java2D Disposer thread. Look below:
| “Java2D Disposer” #17 daemon in Object. wait() [0x000000001946f000] with priorities of 10, 2, and 30. java. lang.Thread.State: WAITING at Java. lang (on object monitor).java.lang.ref.ReferenceQueue.remove(ReferenceQueue.java:143) – locked 0x00000000f03eb540> Object.wait(Native Method) At java.lang .ref.ReferenceQueue.remove(ReferenceQueue.java:164) at sun.java2d, there is (a java.lang.ref.ReferenceQueue$Lock).At java.lang, use Disposer.run(Disp oser.java:148).Thread.run(Thread.java:748) |
None of the ownable synchronizers are locked.
3. After choosing the resource ID (0x00000000f03eb540), check the thread dump file. If there is just one resource ID, then only one thread locked the specified resource.
Step 4: Verify whether any other threads are waiting for the same resource if you detected several instances in the thread dump file. Because of this circumstance, the thread(s) are blocked. The following scenario is one we’ll talk about.
Blocked Thread Scenario
The examination of thread dumps will continue in the following section, which will look at stalled threads. The term “blocked thread” refers to a thread that prevents other threads from using a resource for an extended period of time. As a result, the restricted threads are placed in the Blocked state and given the label “Blocked Threads.” Let’s use an illustration to try to explain. Observe the fast thread dashboard below, which displays the status of 3 threads
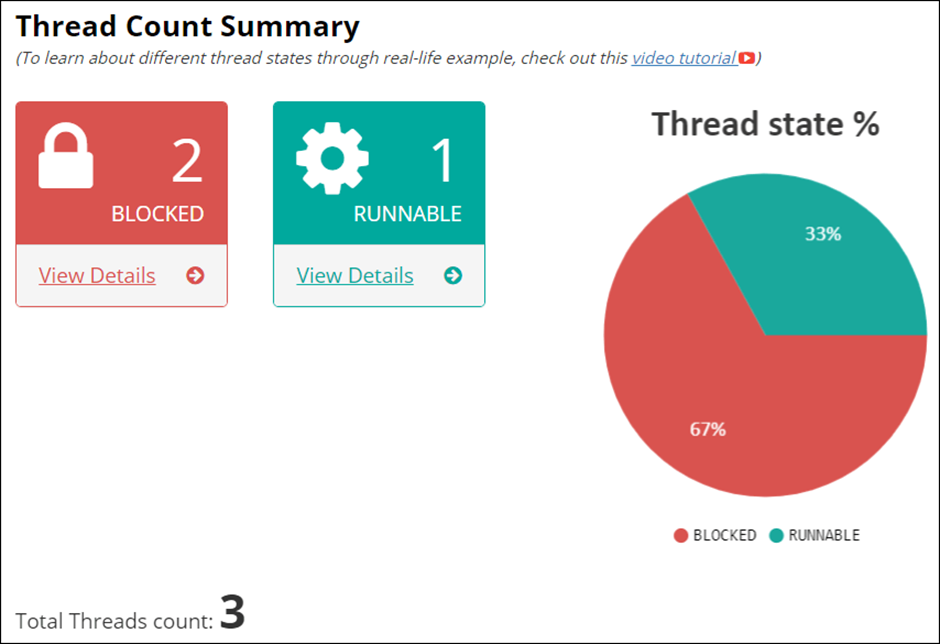
Figure 10: Blocked Threads
According to the Thread Count Summary, out of the three threads, two are blocked while the third, which requires further examination, is in the runnable state.
Referring back to the transitive graph, read the following message:
com. nbsp. the platform. thread dump.ThreadBlockedState is blocking two thread
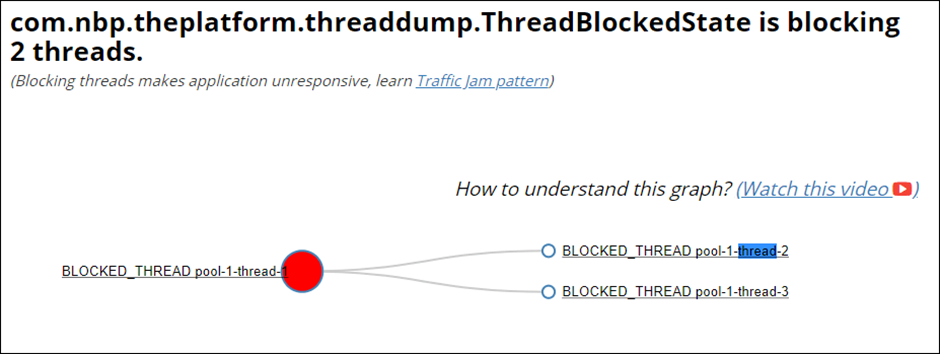
Figure 11: Transitive graph
We can observe that pool 1 thread 1 is obstructing threads 2 and 3.
We can view more details about the thread and locked resources by going to the identical stack trace of a runnable thread. Thread-1’s locked resources are necessary for threads 2 and 3.
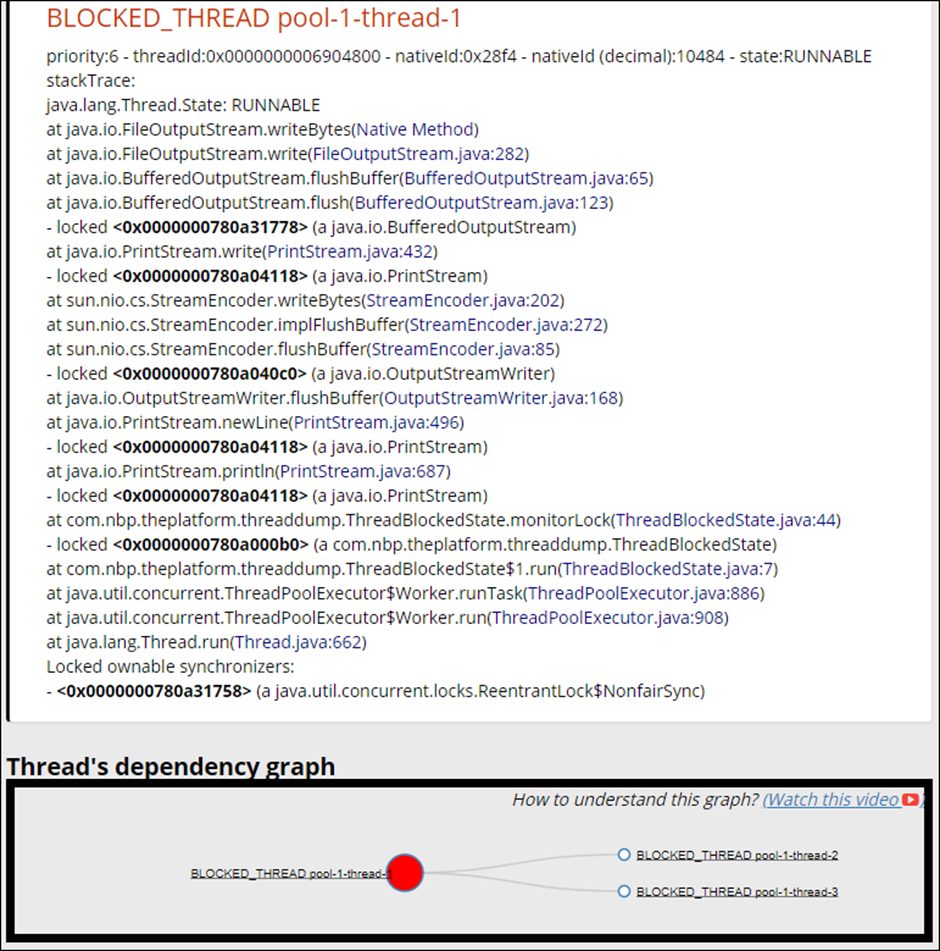
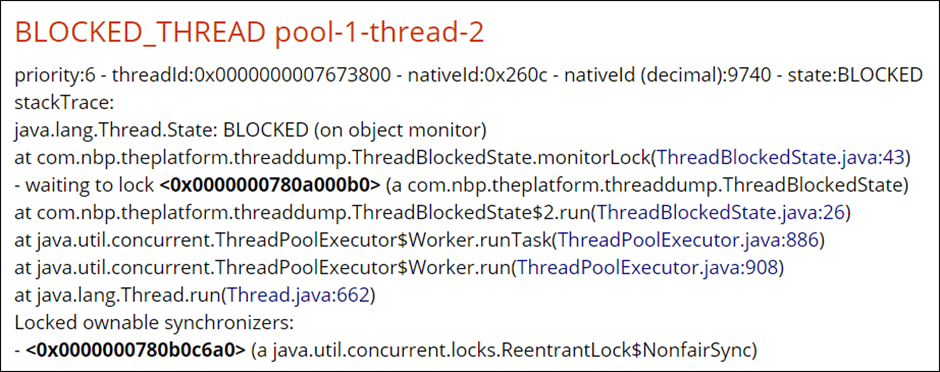
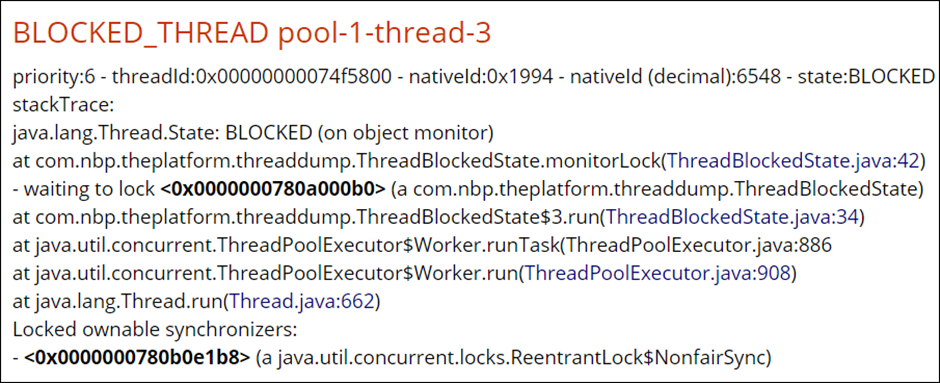
Figure 12: Stack Traces
Deadlocks: Refer to the Dead Lock tab to identify a deadlock. FastThread did not detect any deadlocks, as was discovered. Look below:
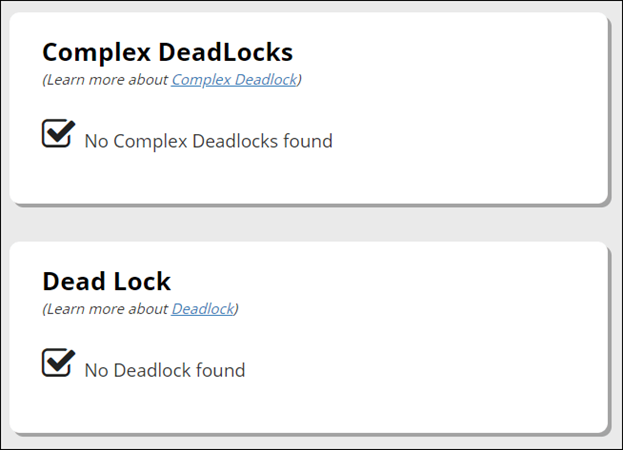
Figure 13: Deadlock Identification
Conclusion:
It has been determined that threads 2 and 3 are waiting for the value 0x0000000750a000b0, which is locked by thread 1, and this is what is causing them to be blocked.
Advice:
If you’d rather manually analyze the dump than use fastThread, take the following actions:
Step 1: Launch Notepad++ and open the thread dump file.
Step 2: Examine the first thread to get the resource ID that was locked by it. An example is the resource 0x00000000f03eb540 locked by the Java2D Disposer thread. Look below:
| “Java2D Disposer” #17 daemon in Object. wait() [0x000000001946f000] with priorities of 10, 2, and 30. java. lang.Thread.State: WAITING at Java. lang (on object monitor).java.lang.ref.ReferenceQueue.remove(ReferenceQueue.java:143) – locked 0x00000000f03eb540> Object.wait(Native Method) At java.lang .ref.ReferenceQueue.remove(ReferenceQueue.java:164) at sun.java2d, there is (a java.lang.ref.ReferenceQueue$Lock).At java.lang, use Disposer.run(Disposer.java:148). Thread.run(Thread.java:748) Ownable synchronizers with locks: -None |
Step 3: After choosing the resource ID (0x00000000f03eb540), check the thread dump file. If there is just one resource ID, then only one thread locked the specified resource.
Step 4: If you discover many instances in the thread dump file, find out if any other threads are awaiting the same resource and, if so, what state they are in. If such threads have the status “Blocked,” you can look into it further. Deadlock is another instance of a blocked thread. In the following instance, we will talk about it.
Deadlock Hypothesis
Deadlock occurs when resources are locked by one thread yet needed by another, which in turn locked resources needed by another thread.
As a result of this cyclical restriction, none of the threads are able to finish their execution, and the system comes to a stop. See the fastThread dashboard below, which displays the status of three threads.
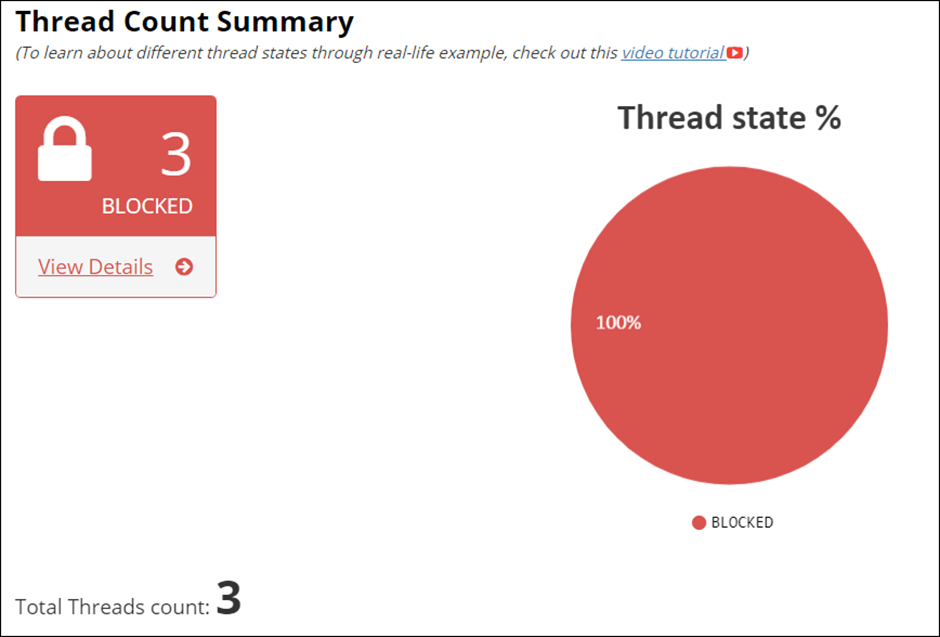
Figure 14: for fast Thread
Look at the part titled “Complex DeadLocks” now:
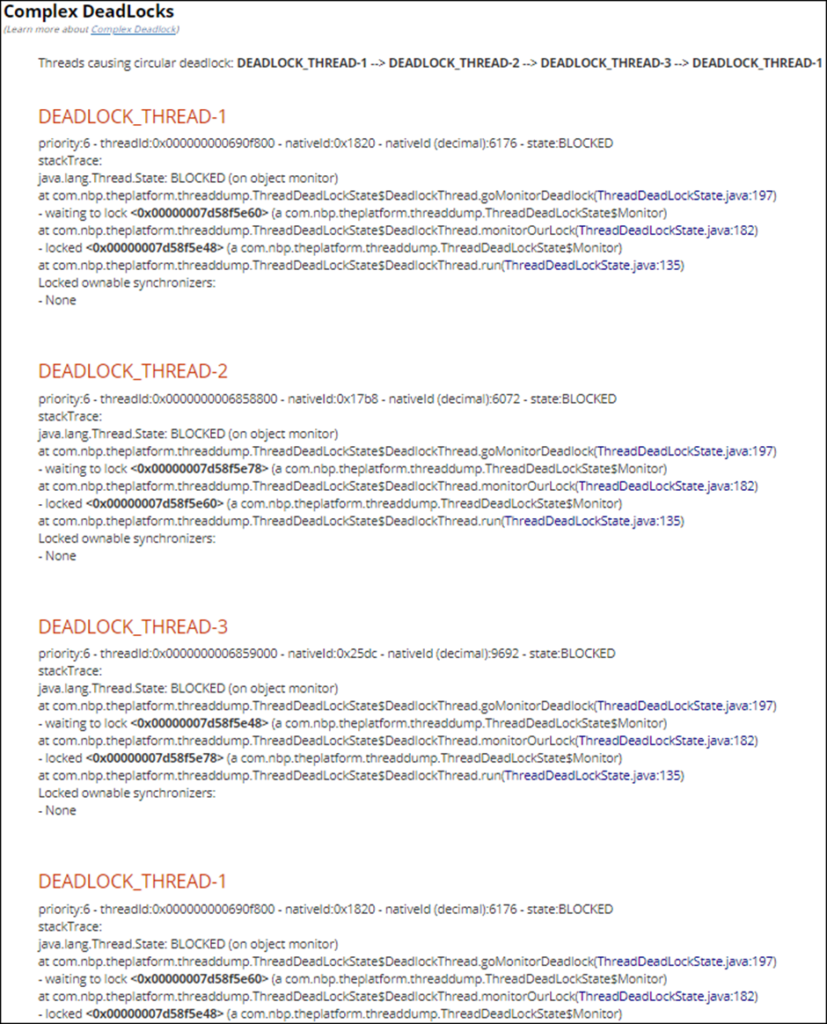
Conclusion:
All three threads combine to form a complex circular stalemate. It is waiting for 0x00000007d58f5e60, which is locked by Thread-2, 0x00000007d58f5e78, which is locked by Thread-3, and 0x00000007d58f5e48, which is once more locked by Thread-1. Thread-1 has locked 0x00000007d58f5e48. Consequently, it causes a deadlock and stops the system.
Advice:
If you’d rather manually analyze the dump than use fastThread, take the following actions:
Step 1: Launch Notepad++ and open the thread dump file.
Step 2: Examine the first thread to determine the resource ID that has been locked by that thread.
Step 3: After choosing that resource ID, scan the thread dump file. If there is only one resource ID listed in the file, then only one thread locked the specified resource.
Step 4: Whether you discovered many instances in the thread dump file, check to see whether any other threads are blocked and waiting for the same resource. If so, choose the blocked thread’s locked resource ID, conduct a search in the thread dump file, and then repeat steps 3 and 4. If the threads lock resources in an interdependent manner, this indicates that they are in a stalemate and warrants further analysis in order to avoid such situations in the future.