Trend Method
“A general direction in which something is developing or changing” is what the definition of trend means. Client, server, and network statistics can be studied using the trend analysis method. Understanding the WHIWH rule before attempting to understand the Trending technique is helpful. Let’s start by discussing how to interpret the chart and locate the bottleneck using the Trend method:
1. Recurring trend
Here is an illustration of a persistent pattern. You can see that with a constant number of users, the response time for payment transactions is stable (0.1 standard deviations). When the response time SLA is met, such trend charts show that there is no bottleneck for the given load.
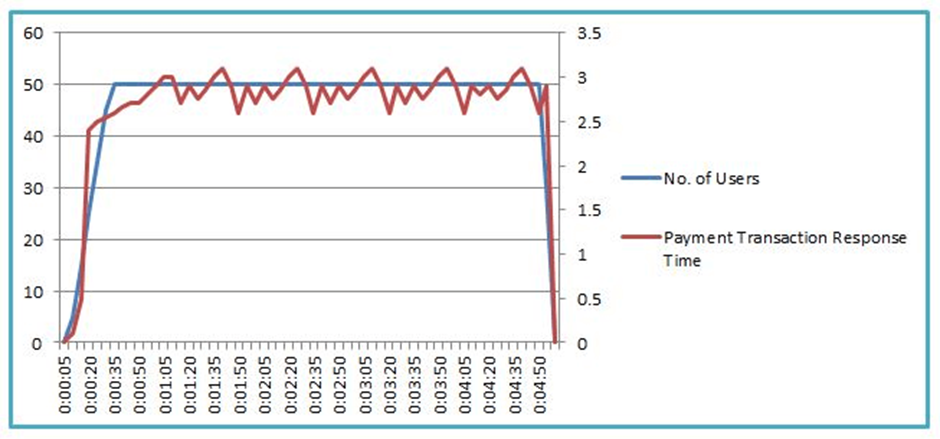
2. Fluctuations
Fluctuations are visible over a long period of time, but the chart is remarkably consistent (within 0.2 standard deviations) in this situation. If the SLA is broken, this can become a bottleneck. The SLA response time for a payment transaction is 3 seconds with a tolerance of 0%; however, if the jitter reaches 3.6 seconds, the SLA is violated.
You can’t consider it if 3.6 seconds (with some tolerance level) fits well within the SLA.
But why did it fluctuate? This suggests an encoding bottleneck rather than a problem with hardware or software resources.
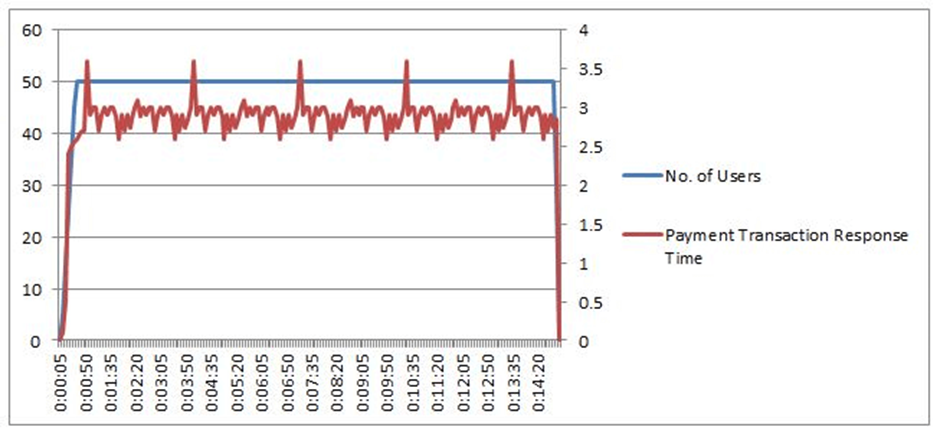
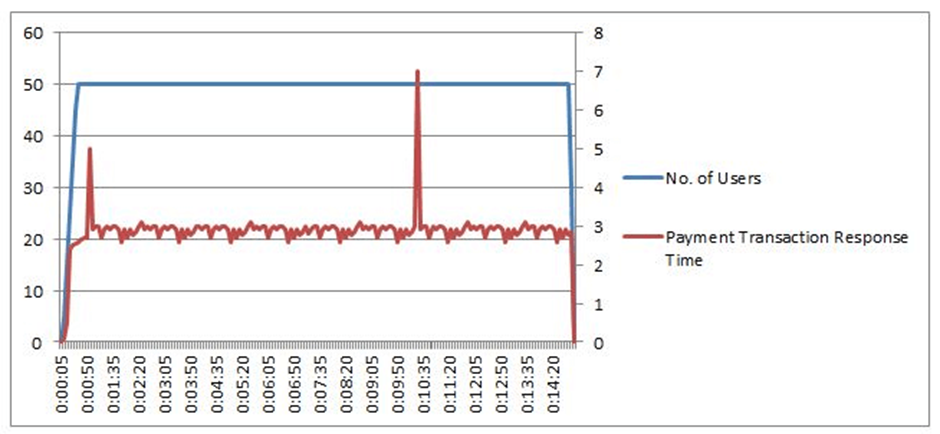
3. Consistent with spikes
If you look at the graph below, you can see that there are two spikes during the performance test, even if the response time is generally constant. Does this increase cause problems? Now it all depends on the system and what is suitable in this place. You can see that it’s 3 seconds and below the acceptable SLA limit if you calculate the 95th percentile. But why are there spikes on it? Spikes can be caused by insufficient system resources, such as threads. Observing the server resources such as threads, GC, CPU usage, connections, process memory, database resources, caching, etc. is a hint to identify the bottleneck.
4. Regular spikes:
In this situation, the response time shows regular spikes. This pattern indicates the scarcity of resources. How can we know which resource is overloaded in this situation? It doesn’t seem like user load per se is the actual cause. Therefore, a resource that is limited by user or time and constrained by the load can be the bottleneck. A possible problem with load distribution is one of the possible offenders. To identify the true source of the bottleneck, a detailed study is helpful. The correlation approach can be used for root cause analysis.
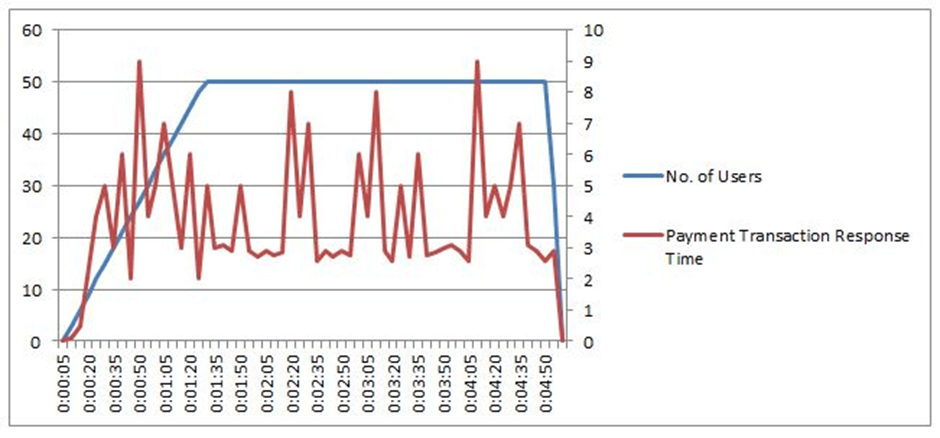
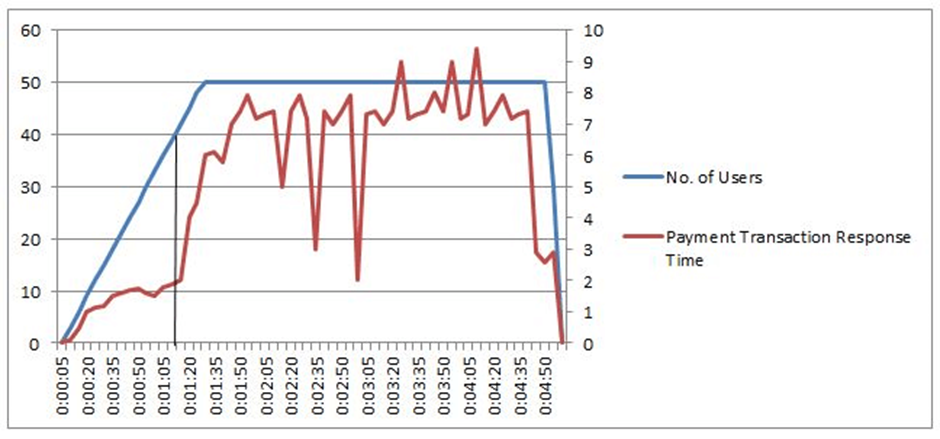
5. Rising Trend:
The graph below illustrates the relationship between user load and a rising response time trend. Response times are adequate under lower user loads, but after the user load reached about 40, they began to rise rapidly. Response time varied from 2 to 9.5 seconds at a continuous load of 50 users. It shows that the system can scale up to 40 people before performance degrades to the point where scaling is no longer possible. It suggests hardware or software capacity difficulties and resource utilization and queuing at various application layers are urged to be examined. One of the causes could be problems with the network bandwidth.