

The ‘vmstat’ command is one of the most established and effective ways to collect memory statistics on Linux servers. Virtual Memory Statistics, or “vmstat,” is a tool that offers a great low-overhead perspective of system performance. Because ‘vmstat’ has such a minimal overhead, it is useful to keep it running on a console even when a server is very busy and you need to quickly check the status of a Linux server.
The utility can be used in average mode or sample mode. The sample mode will calculate statistics for a certain period. When trying to understand performance under a prolonged load, this mode is the most helpful. Selecting a sampling interval allows users to realistically see system activities in real-time.
Command Syntex:
$vmstat
Output
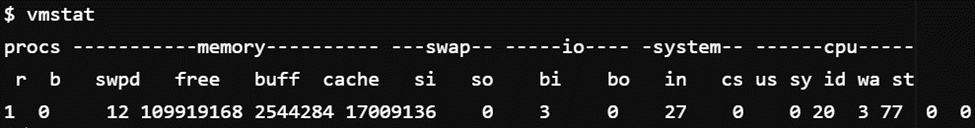
Figure 01
Processes, memory, paging, block IO, traps, disc activity, and CPU activity are all mentioned in the output.
Domain Description
- Procs
- r: The number of processes that are either active or waiting for execution.
- b: The number of blocked processes awaiting successful I/O.
- Memory
- swpd: Virtual memory consumption.
- memory that is unoccupied or free.
- buffer size: The total memory allocated for buffers.
- RAM used as a cache is referred to as the cache.
- Memory that is not being used. (-a choice)
- memory that is now active. (-a choice)
- Swap
- si: The speed at which memory was fetched from the disc (in /s).
- Therefore: The number of memory swaps to disc per second.
- IO
- bi: Blocks received per second (blocks/s) from a block device. the consequences of read operations.
- bo: Blocks per second (blocks supplied to a block device). When write operations happen, the impact.
- System
- in: The clock and the number of interruptions per second.
- cs: The frequency in which context switches occur.
- CPU: These percentages represent the overall CPU time.
- running time devoted to non-kernel code. (User time, pleasant time included)
- Sy: Duration of kernel execution. (Time on the system)
- id: Length of downtime. Before Linux 2.5.41, IO-wait time was included in this.
- WA: The amount of time spent holding out for IO. Previously a part of idle in Linux 2.5.41.
- st: Virtual machine time that has been stolen. unknown prior to Linux 2.6.11.
Options
-a: Display active and inactive memory. Active memory is memory in use by a process. Inactive memory is memory that was allocated to a process that is no longer running.
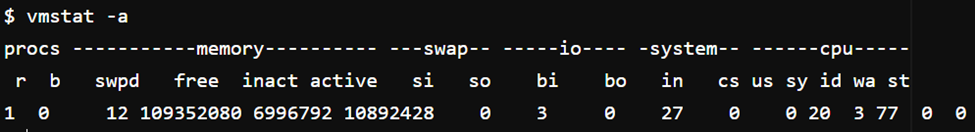
Figure 02
-f: Indicate how many forks have occurred since boot. A new process that is created from an already active one is referred to as a fork.
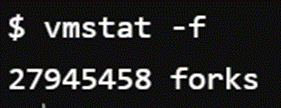
Figure 03
-n: Do not repeatedly display the header; I’m just eleven.
Figure 4
-s: Show a table of various memory statistics and event counters.

Figure 04
d-: Report disk statistics
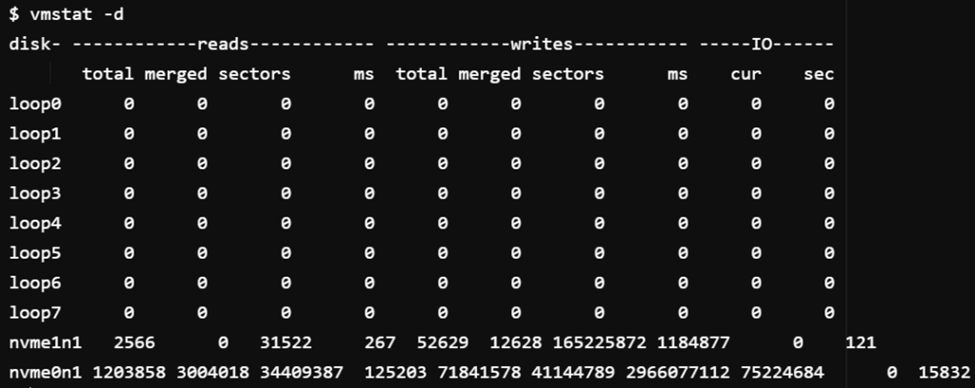
Figure 05
-D: Report some summary statistics about disk activity.
-t: Append timestamp to each line
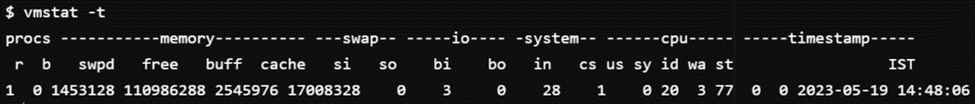
Figure 06
[Delay Value]: The number of seconds between each update to the command output. One report is printed with the average values since boot if no delay is specified. A delay of 5 seconds separates each command output in the example below.

Figure 06
[Count Value]: This value indicates how many outputs are needed. When the delay is defined in the absence of a count value, the default is infinite outputs until the command is terminated. The count value in the sample below is 2, thus only 2 outputs are shown.
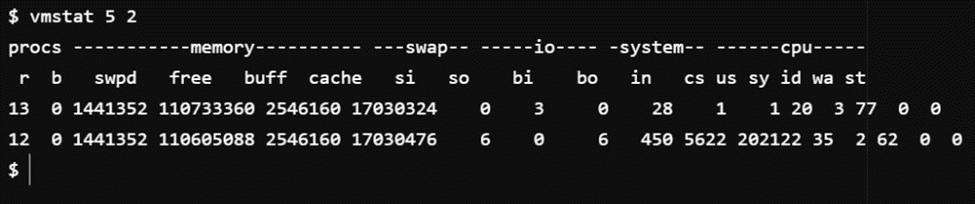
Figure 07
The crucial vmstat command arguments are as follows.
How can I record VMstat when running a load test?
You must run the following command before beginning the load test:
Nohup: $ vmstat [Time Delay] (Count Value) (File Name) &
Example: If you want to run a load test for 1 hour and need to record server statistics in the vmstatLoadTest.dat file every 10 seconds, you will need to multiply 1 hour by 3600 seconds to get 360 as the count value.
And this is the order:
vmstat 10 360 > vmstatLoadTest.dat & $ nohup
After the test is finished, consult the vmstatLoadTest.dat file to assess the results.
To include the timestamp in the command, use -t.
How is a vmstat file analyzed?
The vmstat file can easily be analyzed using MS Excel. You can plot the graphs by choosing the necessary columns after using the ‘Text to Column’ option to divide the statistics into columns.
- ‘us’ value should be lower than 70% (under ideal circumstances)
- If the “wa” value rises, the CPU will need to wait for the IO resource.
- When many memory pages are swapped in and out to the swap file on the hard drive to obtain extra RAM, the values for “si” and “so” rise.
- The values of ‘bi’ and ‘bo’ are altered by read and write operations.
- If the amount of context switches (cs) does not increase dramatically but the user CPU percentage (us) is high, this may indicate that a single-threaded application used a lot of processors for a little period.
- A single process is requesting resources from hardware devices if there are a lot of interrupts (in) and few context switches (cs). The user (us) time needs to be consistently high to further prove that an application exists. The process starts on the thunk and stays on the thunk beyond the minimum number of context switches (cs).
- Since there are more context switches than interrupts, the kernel has to spend a lot of time on context switch threads.
- A large number of context switches causes an unhealthy balance of CPU usage. If the usage rate is very low and the IO wait % is extremely high, it can be tested.
Significant points
- No special permissions are required to run vmstat.
- The ‘vmstat’ command is part of the ‘sysstat’ system monitoring utility, which creates statistics and reports on CPU and device usage.
- To get information about the monitoring of the Linux server before, after, and during the test, calculate the value of Count allowing some additional time for the load test.